Written by: White55, Mars Finance
The Bitcoin market is staging a classic battle between bulls and bears. After hitting a historical high of around $123,250, BTC has retraced 7.50% within three weeks, briefly falling below the $113,000 mark. However, analysts see beyond the surface - the strong support of the 50-day Exponential Moving Average (EMA) coinciding with the neckline of an inverse head and shoulders pattern forms a "perfect bottom" technical structure. Meanwhile, on-chain data shows that the "old whale's" $9.6 billion sell-off is not bearish, but rather similar to the profit-taking after the March 2024 ETF approval and the potential Trump victory in late 2024, with the market experiencing more intense rallies after such historic sell-offs.
I. Technical Resonance: Double Support Constructing a Bull Market Launchpad
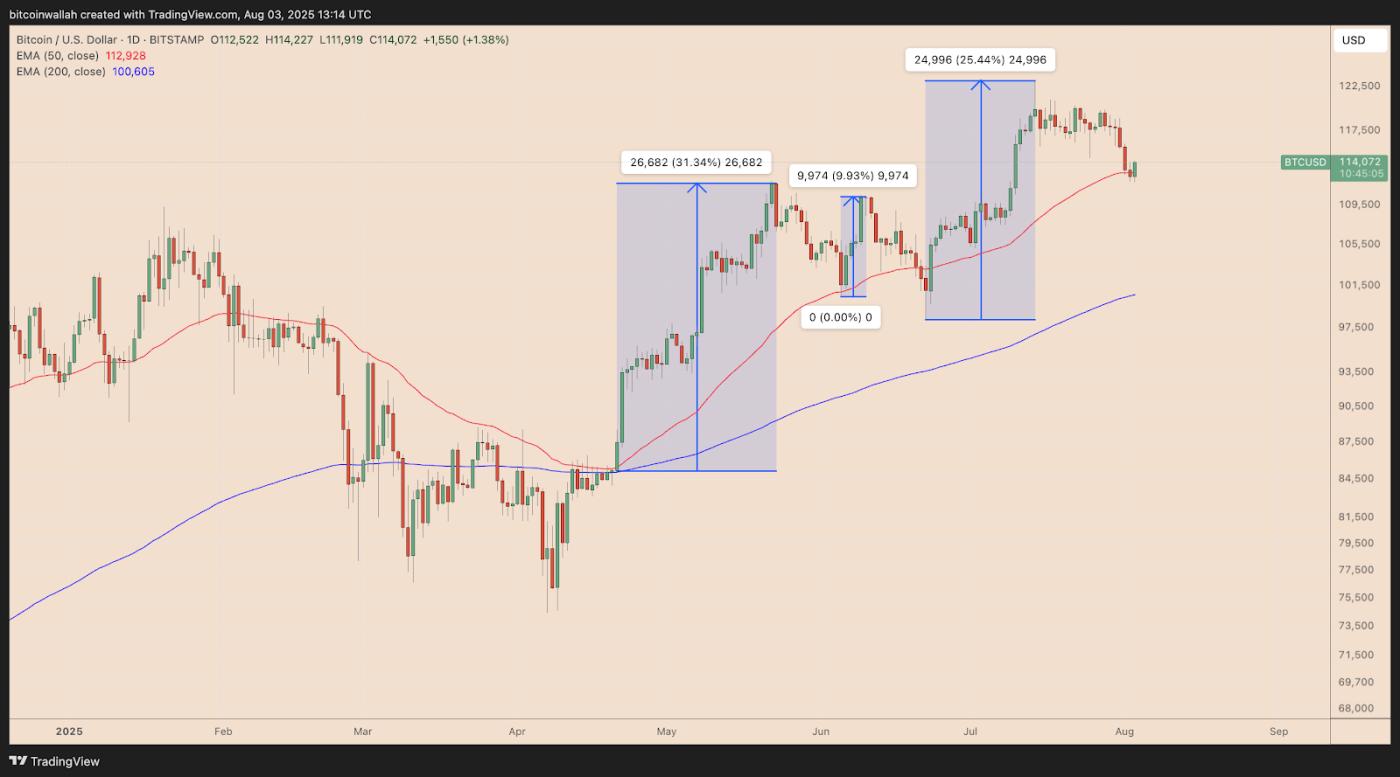
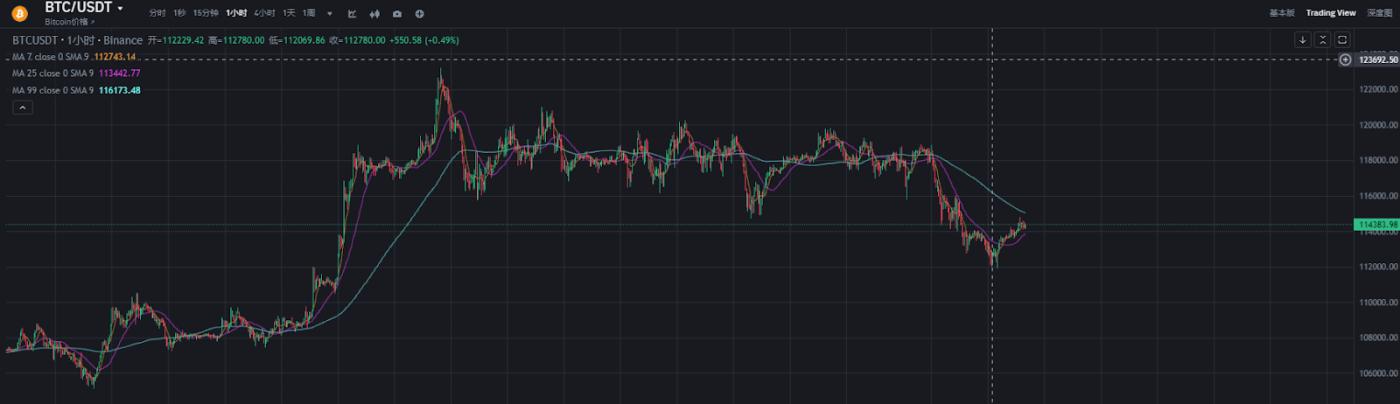
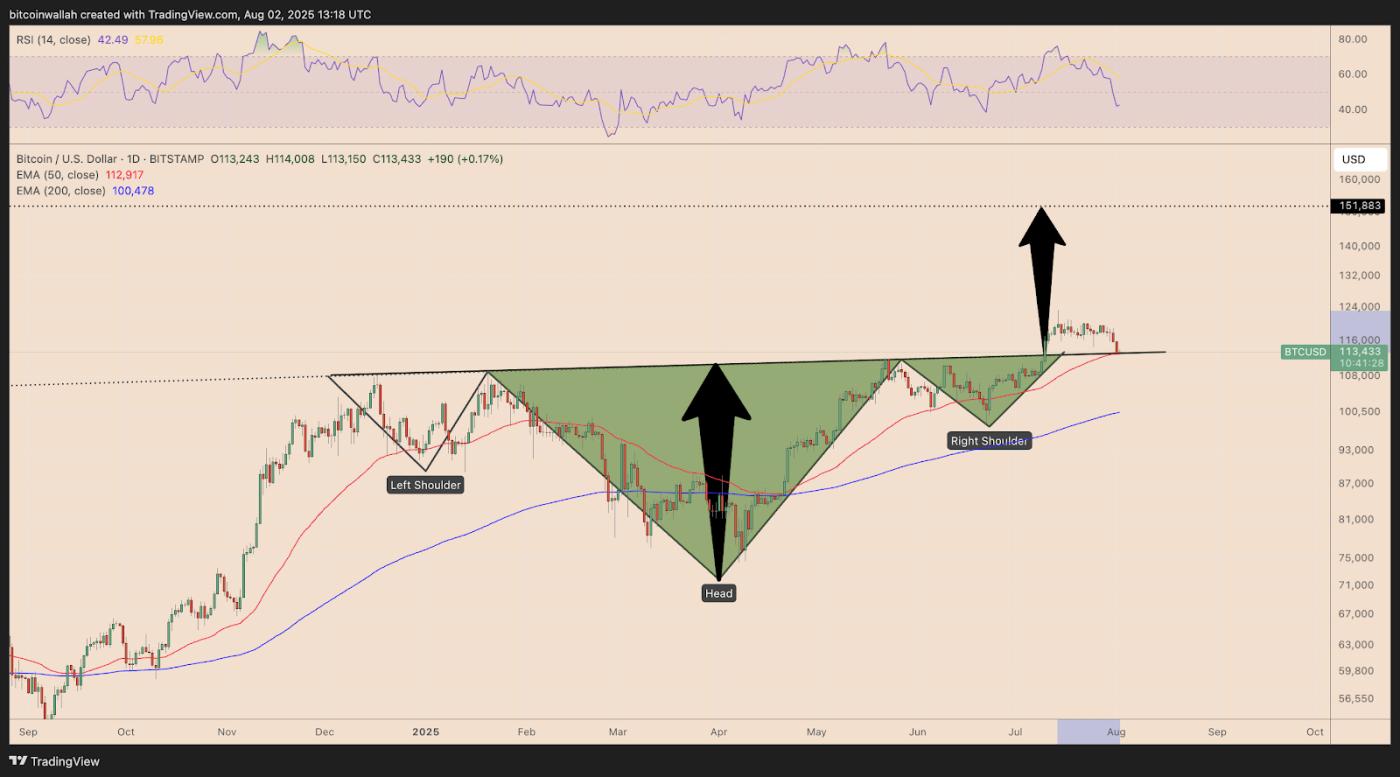
BTC/USD daily price chart. Source: TradingView
Bitcoin's daily chart is outlining a typical bull market correction path. On Sunday (August 3rd), the price quickly recovered after briefly breaking below the 50-day EMA (red wave line), repeating the technical script from June - when a similar break triggered a 25% rapid rebound. This moving average has been a bull fortress since the 2025 bull market, with three pullbacks transforming into upward momentum.
 BTC/USD daily price chart. Source: TradingView
More notably, the 50-day EMA forms a technical resonance with the inverse head and shoulders (IH&S) pattern's neckline. After breaking through this neckline in late July, the current pullback is viewed as a retest of the breakthrough's validity. If successfully held, it will open an upward space with a measured target of $148,250. This target echoes the weekly-level rounded bottom formation (target $140,000) and the bull flag breakout (target $150,000).
The market structure has quietly transformed: CME $115,000 gap filled, high-leverage positions cleared, and financing rates returning to a healthy range, clearing obstacles for a "net bullish rise".
II. Whale Game: The Cooling Mechanism Behind the $9.6 Billion Sell-off
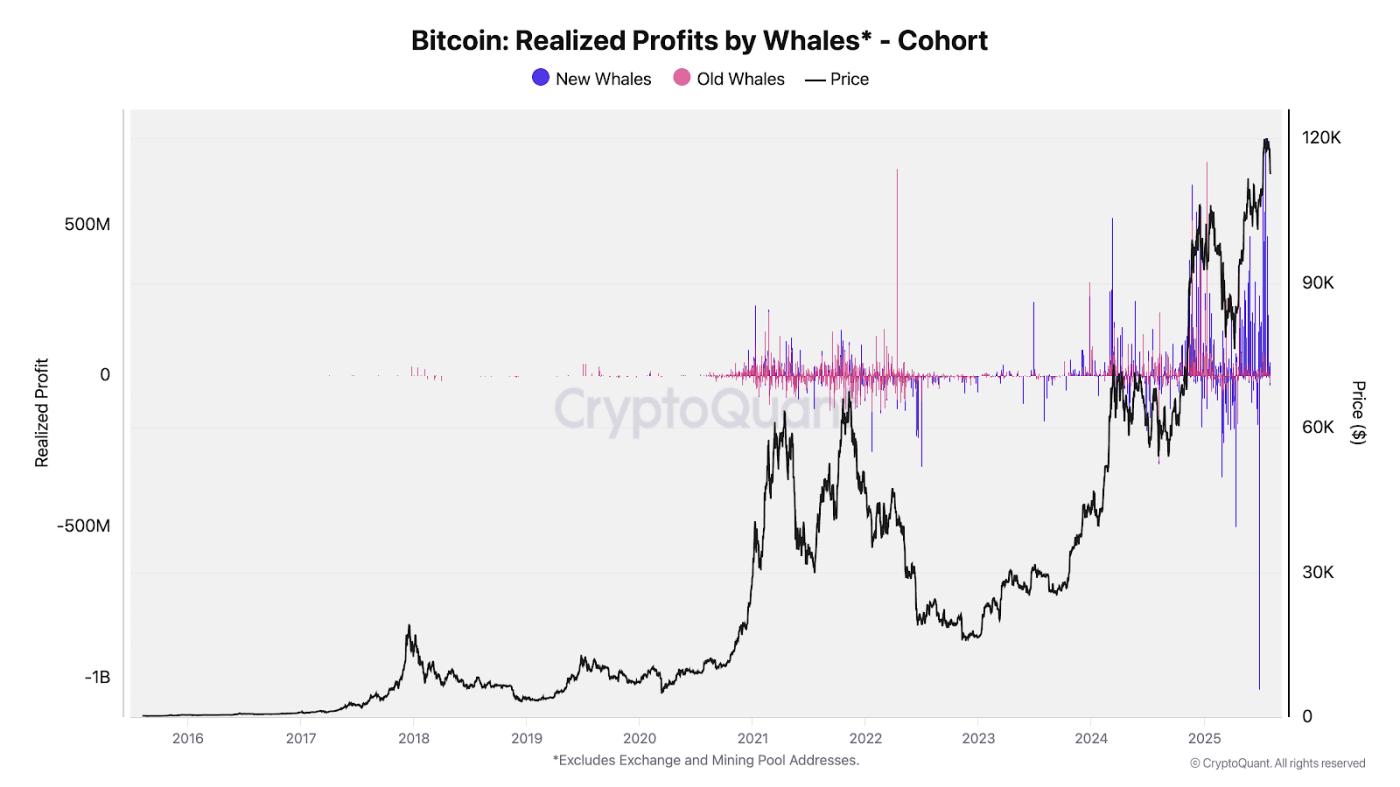 Both Bitcoin "old whales" and "new whales" have profited. Source: CryptoQuant
On-chain data reveals the strategic deployment of institutional-level funds. CryptoQuant monitoring shows three concentrated whale profit-taking waves in this bull market:
- March 2024: After the US spot Bitcoin ETF approval, $8.5 billion net inflow stimulated the first sell-off
- November 2024: Trump's victory pushing BTC above $100,000 triggered the second round of reduction
- July 2025: After historically breaking $120,000, "old whales" transferred 80,000 BTC (about $9.6 billion) in a single move
These "whale descending" events are accompanied by 2-4 month consolidation periods, serving as natural market cooling valves.
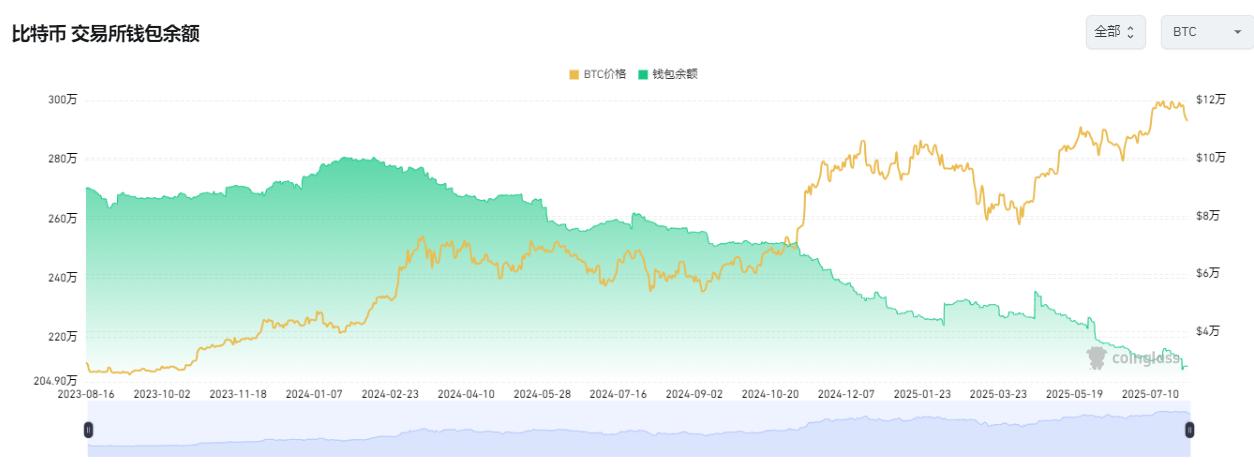
However, current data indicates that whales continue to accumulate: addresses holding 10-10,000 BTC have added 83,105 BTC in the past 30 days, with exchange balances dropping to 2.44 million coins (six-year low), showing strong long-term holder reluctance to sell.
III. Macro and Funding: Liquidity Tailwind in the Rate Cut Cycle
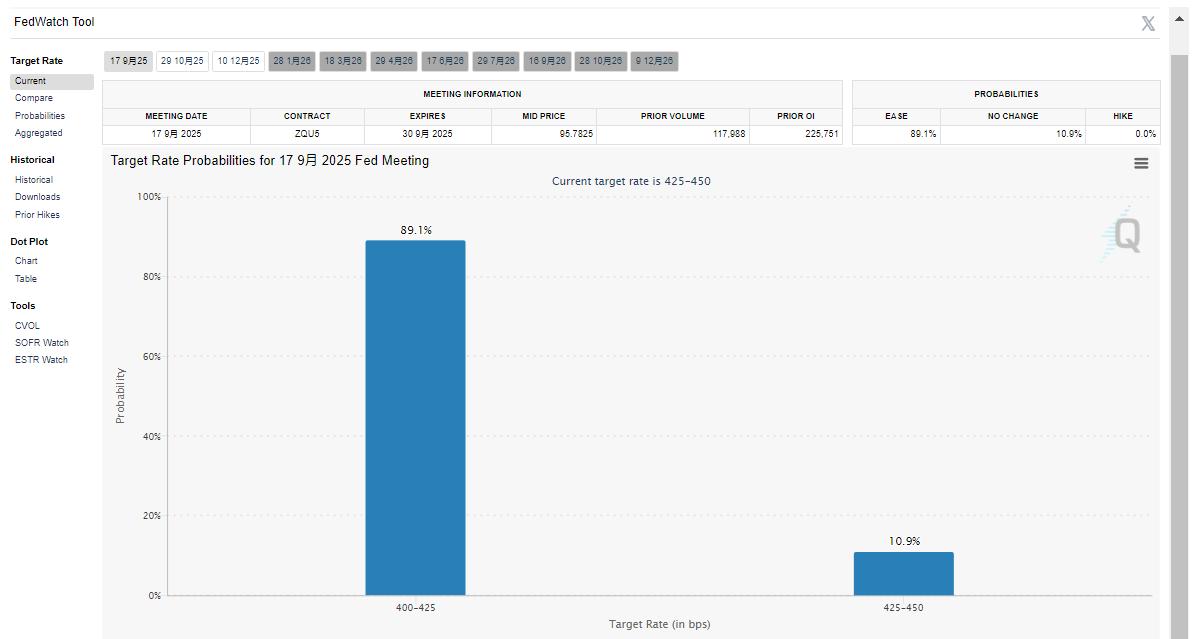
Bitcoin's rise logic is deeply tied to global monetary policy. The US July non-farm data "unexpectedly cooled" (only 73,000 jobs added, unemployment rate rising to 4.2%) completely reversed market expectations, with the Fed's September rate cut probability soaring to 80%. This confirms the previous Snowball column's prediction: under the overlay of $31 trillion Treasury issuance and the rate cut cycle, Bitcoin will become a beneficiary of the "fiscally dominated" paradigm.
Fund inflows are experiencing structural changes:
- Continuous ETF inflows: Spot Bitcoin ETF net inflow of $2.9 billion in two weeks, BlackRock holding over 700,000 BTC, with management fees crushing S&P 500 ETF
- Corporate reserve monetization: Mexican hotel giant investing $500 million in BTC, Japan's Metaplanet holding over 2,200 coins, with medical, chip, and other traditional industries following suit
- Ethereum ETF counterattack: Zero outflow for 10 consecutive weeks, monthly inflow of $3.5 billion setting a record, with staking yields (4% annually) making it a "digital bond"
IV. $150,000 Target: Resonance of Historical Cycles and Technical Patterns
Multiple technical models point to the 140,000-150,000 dollar target range:
- Rounded bottom formation theory: After breaking the daily neckline at $106,660, the measured target is $140,000 (37% higher than current price)
- VIX correlation model: When the volatility index is below 18 in a "risk appetite" environment, Bitcoin network economist Timothy Peterson predicts a 100-day target of $135,000 (95% accuracy)
- Halving cycle rule: After the fourth halving in May 2024, historical data shows bull market peaks occurring 12-18 months later, with October 2025 being a key time window
The essential logic supporting these targets is Bitcoin's "asset repricing": it has transformed from a marginal speculative asset to a corporate balance sheet allocation tool. With MicroStrategy holding 190,000 BTC and BlackRock incorporating it into its trillion-dollar asset management empire, Bitcoin's liquidity has overwhelmed gold, becoming a new "corporate reserve standard".
While mainstream media remains cool and retail investors panic over non-farm data, smart money is strategically positioning. From CME gap fill to whale handover, from rising rate cut expectations to the spread of corporate Bitcoin hoarding, technical and fundamental aspects have formed an upward resonance. If historical patterns repeat, the current volatility might be the final wash-out before Bitcoin's push to $150,000.