Get the best data-driven crypto insights and analysis every week:
Taking Stock of Crypto Exchanges Pursuing an IPO
By: Tanay Ved, Victor Ramirez
Thanks for reading Coin Metrics' State of the Network! Subscribe for free to receive new posts and support our work.
Key Takeaways:
Kraken, Gemini and Bullish are preparing to go public amid a favorable regulatory backdrop and investor appetite for public market exposure.
Coinbase’s 2021 IPO set the benchmark, debuting at a $65B. At the time, 96% of their revenues came from transaction fees on trading, with subscription and serivices revenue now making up 44% in Q2 2025.
Among IPO candidates, Coinbase still leads with 49% of spot volume. Bullish and Kraken hold 22% each, and are rapidly expanding into new services.
Not all reported volume is created equal. Round-trip trade analysis highlights inflated activity on some platforms and underscores the need to evaluate exchange quality and transparency.
Introduction
For much of its existence, past US presidential administrations have met the crypto industry with apathy at best and outright hostility at worst. But last week marked a constructive shift.
The Presidents Working Group for Digital Assets published a 166 -page report that outlined the digital assets landscape and set forth policy recommendations for establishing a comprehensive market structure. Meanwhile, SEC Chairman Paul Atkins introduced the agency’s “Project Crypto” initiative in a public speech. This laid out the vision of making the US the “crypto capital of the world” by bringing financial markets on-chain, simplifying the onerous licensing structure for crypto businesses, and enabling the creation of financial “super-apps” that offer a broad range of services under one roof.
A prime benefactor of this new regulatory regime are centralized exchange businesses. Several private centralized exchange businesses such as Kraken, Bullish, and Gemini, are seizing this relatively favorable environment to pursue an Initial Public Offering (IPO). As these companies become investable to the public, it’s important for investors to be aware of their fundamental drivers. In this issue of State of the Network, we break down the key metrics for evaluating these exchanges and note some disclaimers about using data reported by exchanges.
The Crypto Exchange IPO Spree
After Coinbase went through IPO in April 2021, we saw a drought in crypto-related IPOs over the last four years (due in large part to the adversarial relationship between crypto companies and the previous SEC). As a result, private companies were shut off access to liquidity from public markets and non-accredited investors were locked out of capturing upside from investing in these businesses. With the Trump administration promising a friendlier regulatory regime, a new wave of private crypto companies announced their intent to go public.
This environment, matched with renewed appetite for public market exposure has resulted in some of the most explosive IPO’s, such as Circle’s recent public debut. Gemini, Bullish and Kraken are eyeing a public listing in the U.S., looking to capitalize on this open window and position themselves as full-stack providers for digital assets.
Coinbase’s 2021 IPO
Coinbase’s 2021 IPO offers a useful benchmark for evaluating the investment outlook of prospective exchange IPOs. The company went public on April 14th 2021, via a direct listing on Nasdaq. Its reference price was set at $250 per share, implying a fully diluted valuation of $65B, with shares opening at $381. Coinbase’s debut came at the highs of the 2021 bull market, with BTC trading near $64K and exchange volumes exceeding $10B.
As outlined in its S-1 filing, Coinbase’s business model at the time was straightforward, with a vast majority of revenue from facilitating trades:
“Since inception through December 31, 2020, we generated over $3.4 billion in total revenue, largely from transaction fees that we earn from volume-based trades on our platform by retail users and institutions. For the year ended December 31, 2020, transaction revenue represented over 96% of our net revenue. We have leveraged the strength of our trading business to scale and broaden our platform by investing in our flywheel to launch new products and services and grow the ecosystem.”
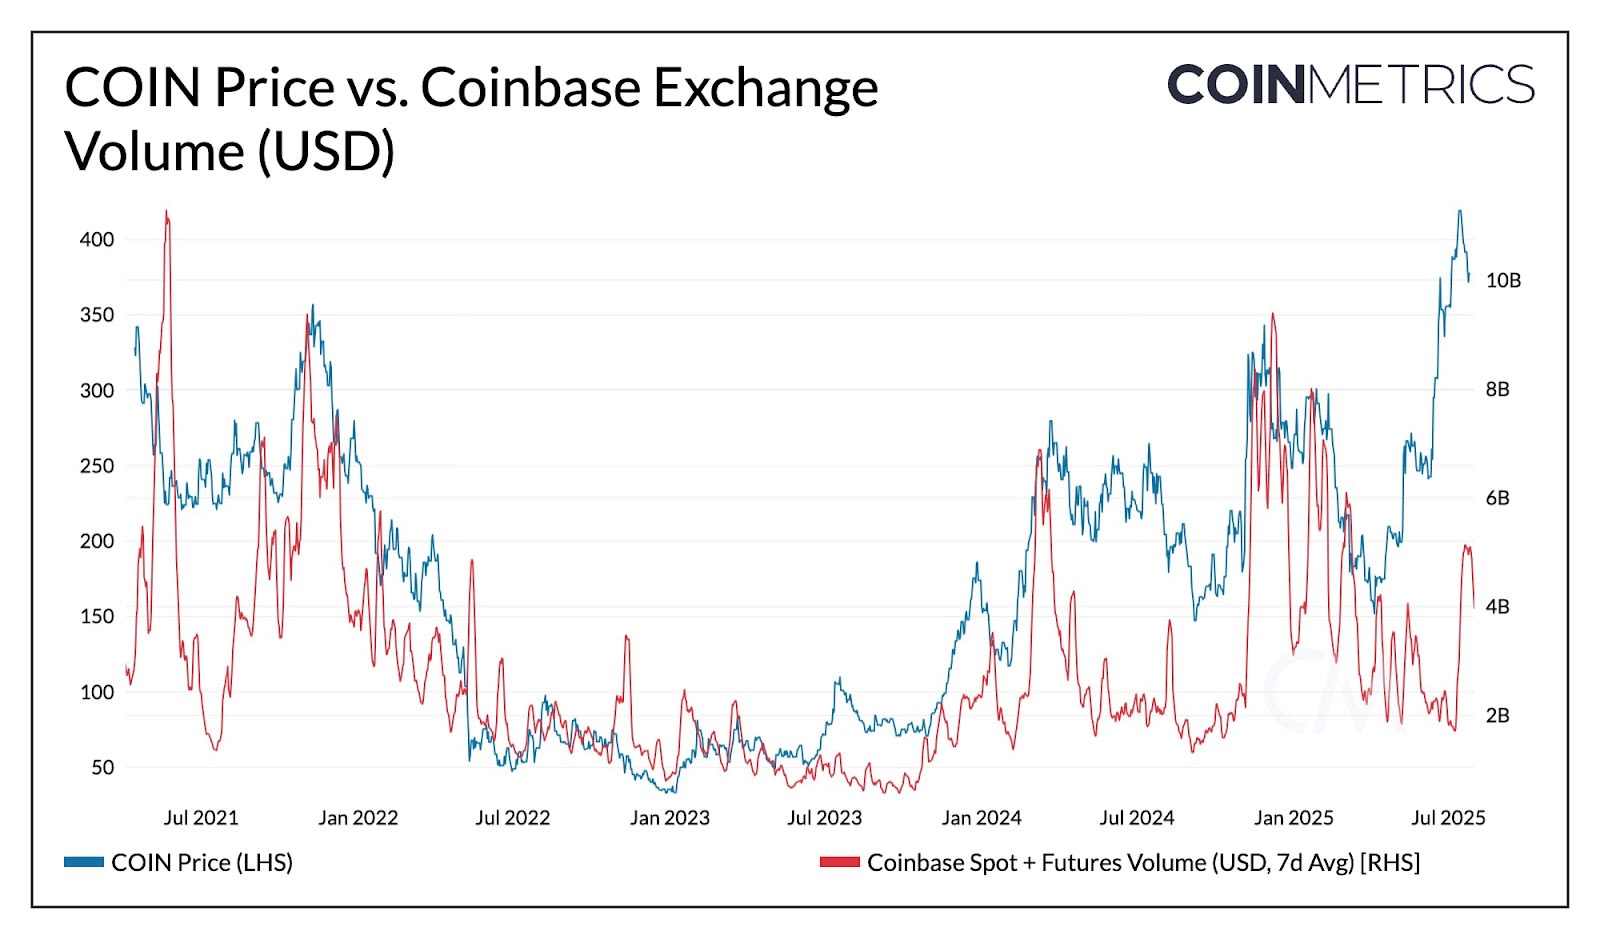
Source: Coin Metrics Market Data Pro & Google Finance
Fast forward to today, and Coinbase looks more like an “everything exchange”. While trading remains core to its operations, its business model has significantly broadened across the full-stack of crypto services. This change is starting to appear in the relationship between COIN’s price and exchange volumes, which tracked each other closely in the early years.
However, this correlation has weakened as “Subscription & Services Revenue”, composed of segments like stablecoin revenue (USDC interest income), blockchain rewards (staking) custody revenue has grown in relevance:
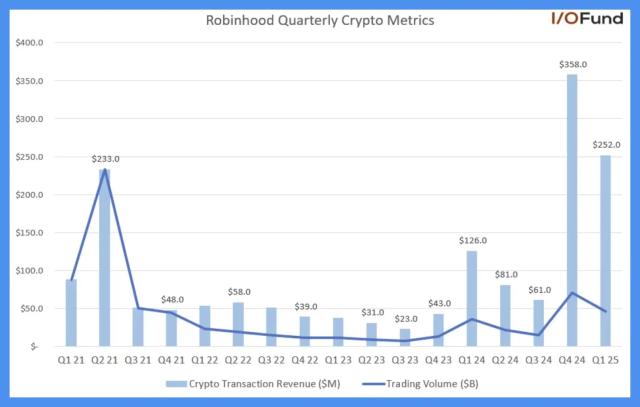
Coinbase Q1 2021:$1.6B in Revenue
$1.55B (96%) Transaction Revenue
$56M (4%) Subscription and Services Revenue
Coinbase Q2 2025:$1.5B in Revenue
764M (51%) Transaction revenue
656M (44%) Subscription and Services Revenue
77M (5%) Corporate Interest
A Comparative Look Into Upcoming Exchange IPOs
With this framework in mind, we lay out the estimated valuations, trading volumes and business segments for exchanges approaching their IPO.
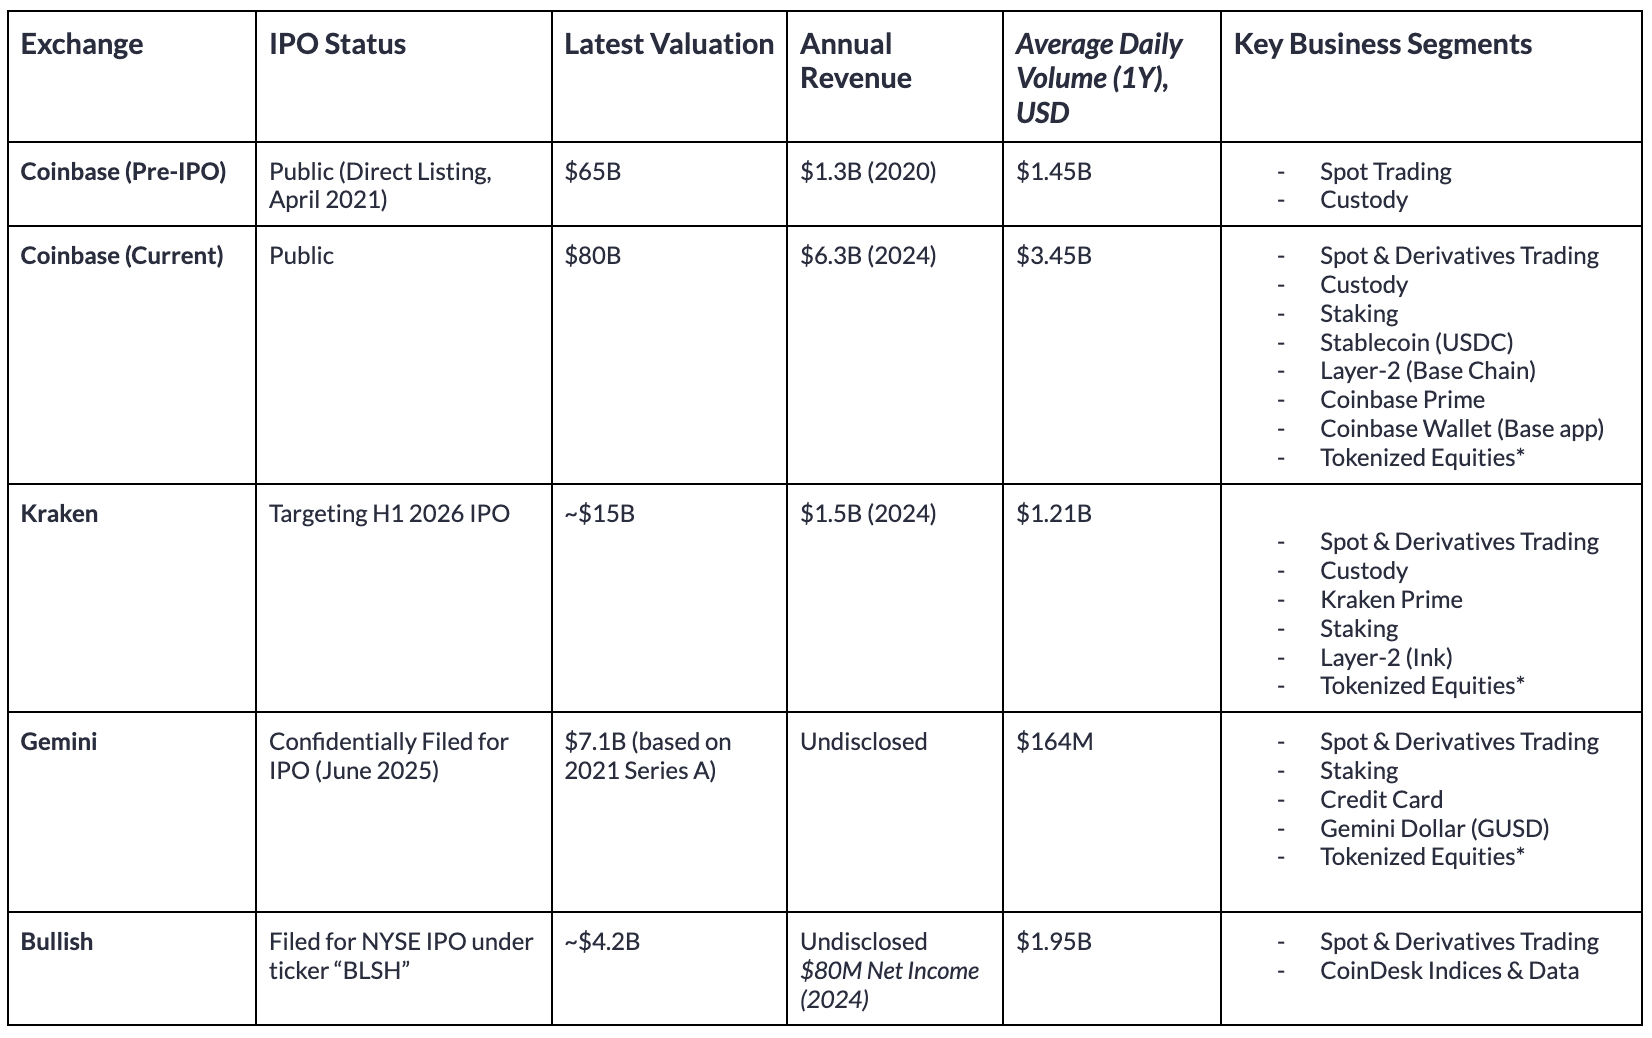
Source: Coin Metrics Market Data Pro & Public Company Filings (Data as of 2025-08-01)
While these exchanges are converging in the services they offer, they differ meaningfully in their market presence and scale of trading activity.
With its launch in 2013, Kraken appears to have reached a greater stage of maturity. The company has seen strong financial growth, reporting $1.5B in 2024 revenue (a 128% from 2023), and $412M in Q2 2025 revenue. Kraken has also expanded strategically, acquiring NinjaTrader, securing MiCA licensing in Europe, and is expanding into tokenized equities, payments and on-chain infrastructure (Ink). At a targeted valuation at ~$15B and $1.5B in 2024 revenue, Kraken is priced at a 10x revenue multiple, slightly below Coinbase’s trailing 12.7x.
In comparison, Gemini operates at a smaller scale. Its $164M in average volume over the past 1-year is the lowest among these exchanges. Gemini’s last known valuation dates back to $7.1B in a 2021 Series A, with private markets pricing the company at $8B. Beyond its spot and derivatives business, Gemini offers staking and credit card products providing users yield on deposits, and is also the issuer of Gemini Dollar (GUSD), which has seen its circulating supply fall to 54M.
Bullish ranks near the top of trading activity with $1.95B in average trading volume over the past year. Bullish Exchange is at the core of their trading and liquidity infrastructure, which functions as an institutionally focused exchange regulated in Germany, Hong Kong and Gibraltar, while actively pursuing a license in the U.S.. Beyond this, Bullish has also expanded into information services with its acquisition of CoinDesk. In an F-1 filing, the company revealed that it made net income of $80M in 2024, and net loss of $349M. Initially valued near $9B based on a scrapped 2022 SPAC deal, Bullish is now reportedly seeking a $4.2B valuation.
Volume Trends Across Exchanges
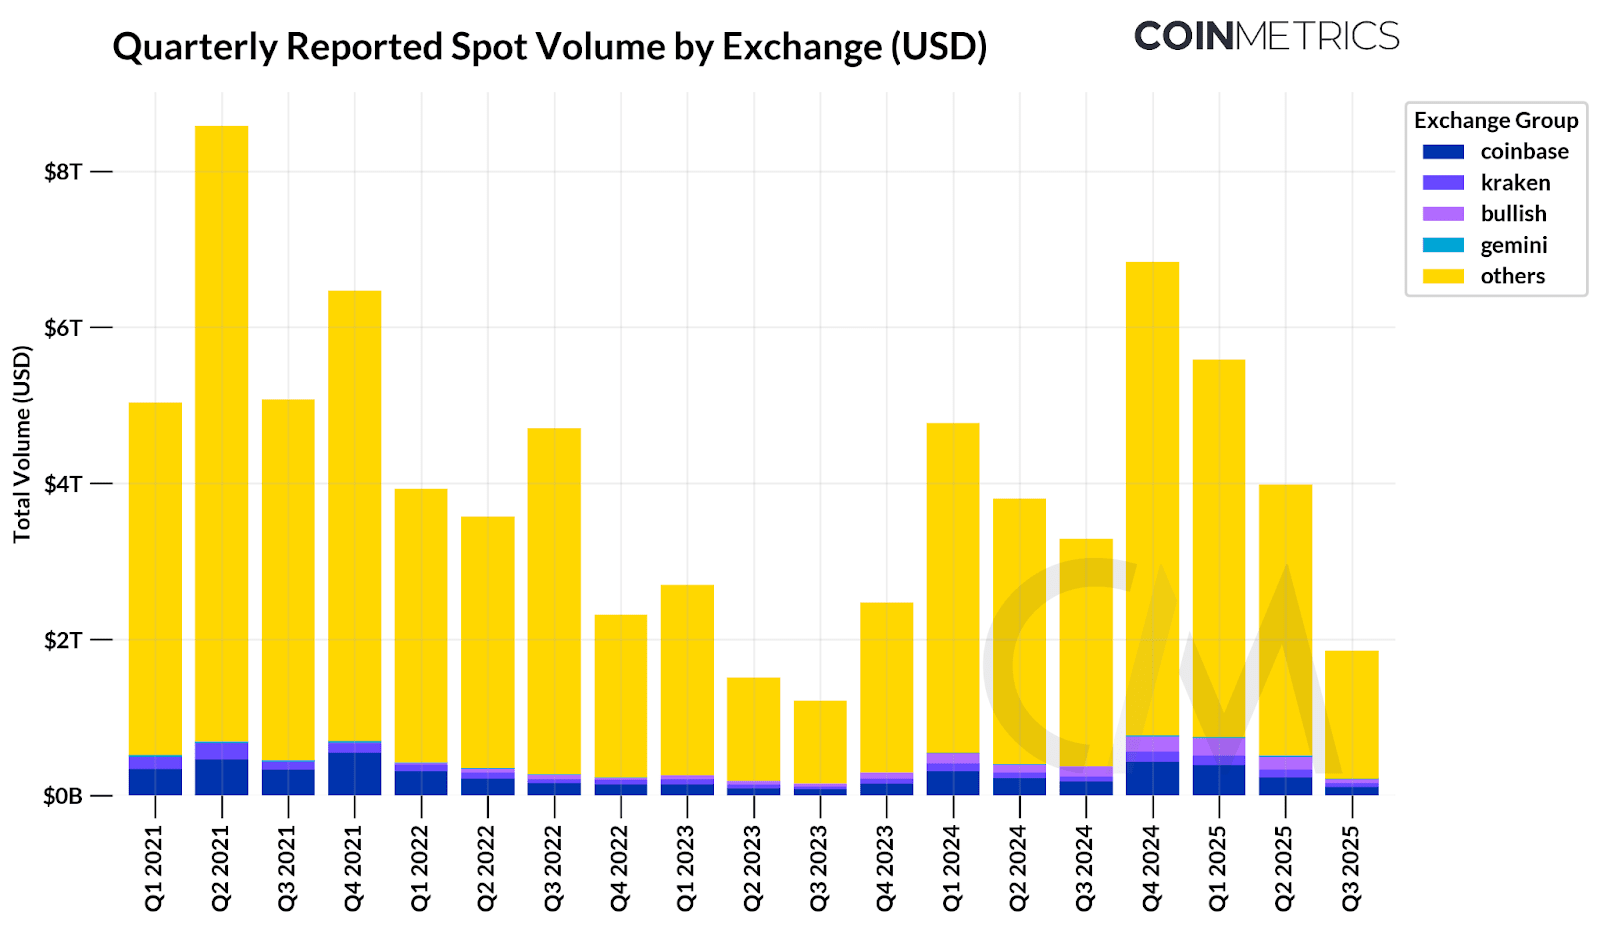
Source: Coin Metrics Market Data Pro
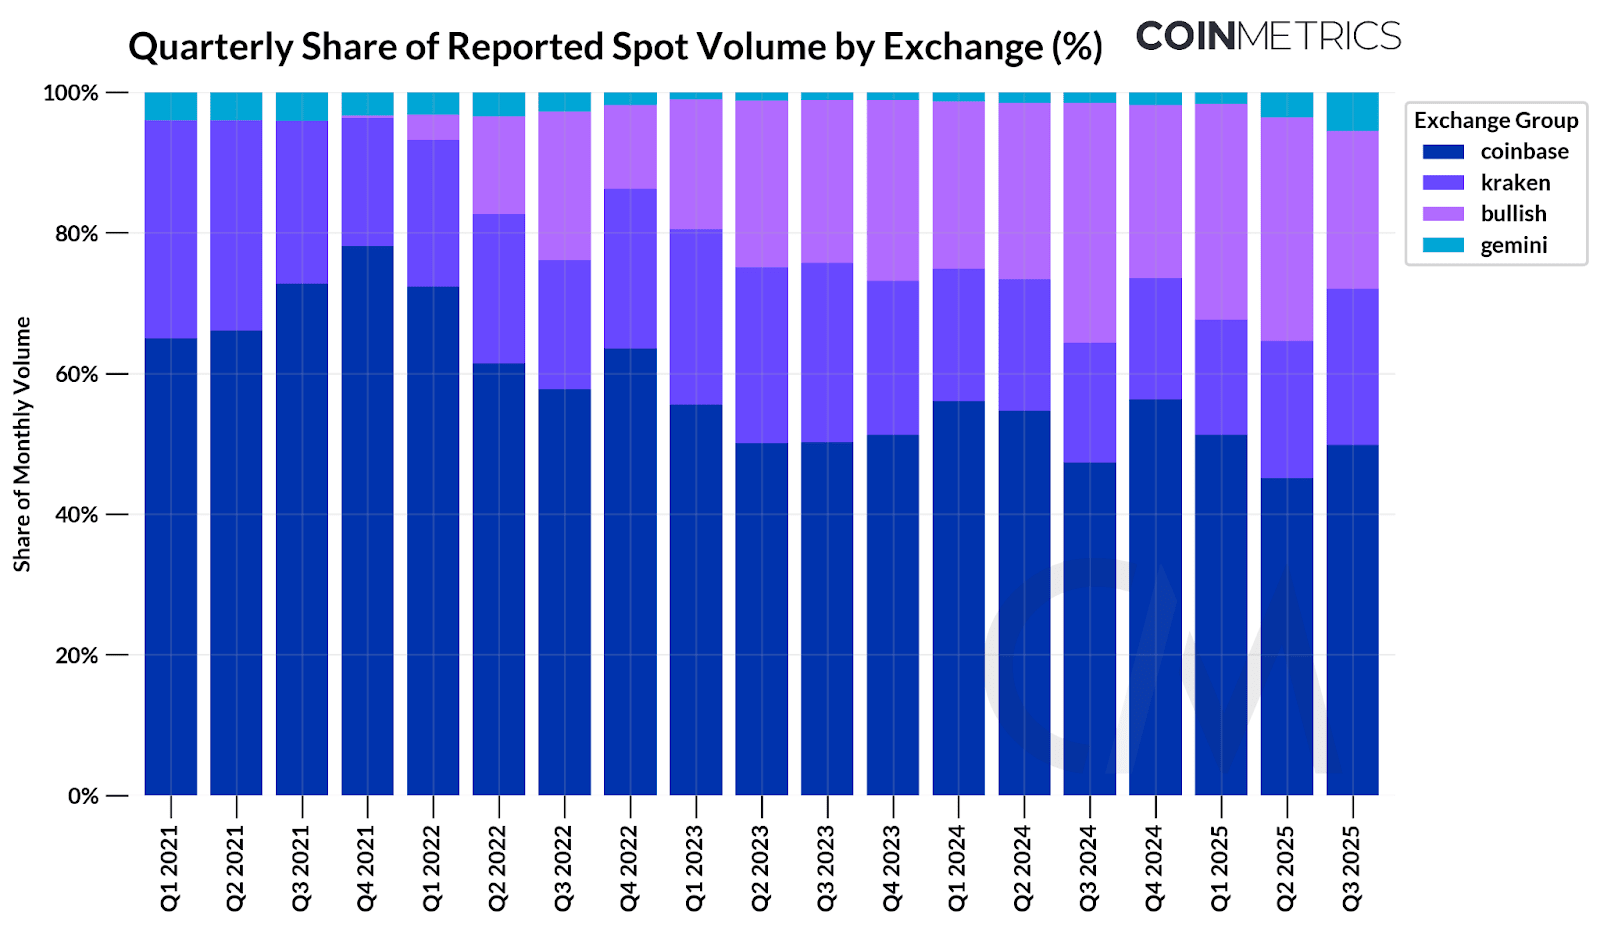
In aggregate, Coinbase and other exchanges moving towards an IPO represent just ~11.6% of reported spot volume across trusted centralized exchanges. Binance alone accounts for 39%, while other offshore exchanges also command a large share. When isolated to the exchanges of interest, Coinbase accounts for 49% of spot volume, followed by Bullish and Kraken, both capturing 22% each. Bullish has steadily gained share since its introduction in 2022, while Kraken’s footprint has narrowed as competition intensifies.
Source: Coin Metrics Market Data Pro
A Round Trip Along the Orderbook: Examining Economic Activity Across Exchanges
As we’ve seen above, transaction volume is one of the most highly predictive metrics to estimating valuation. But the volume being reported can be a misleading data point depending on the exchange.
Although most of the major crypto exchanges have cracked down on wash-trading, there still exist pockets of the wild west. Our Trusted Exchange Framework methodology has a thorough breakdown of how to detect unusual trading activity as well as an evaluation of qualitative factors such as regulatory compliance.
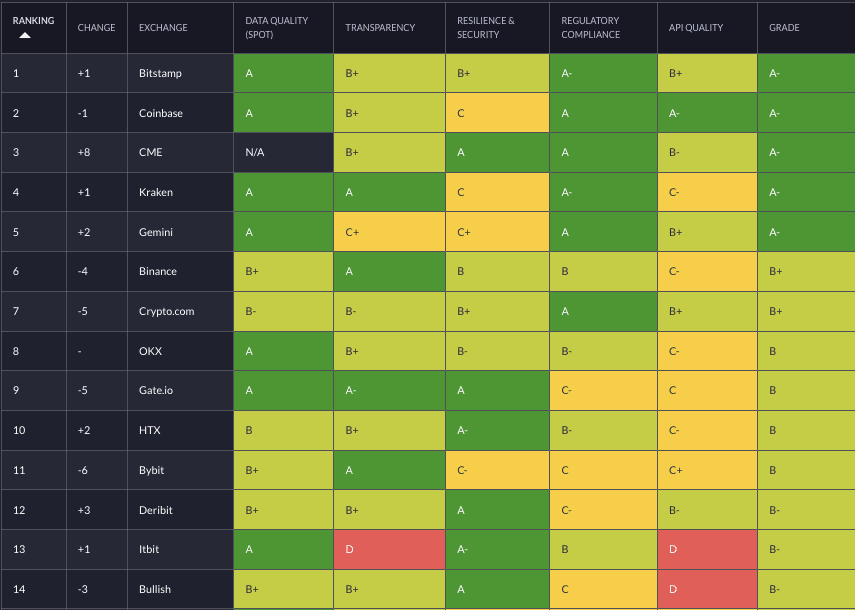
Source: Trusted Exchange Framework
One of the more powerful signals we’ve developed for detecting wash-trading is calculating the frequency of round trip trades. Our methodology for this test is as follows:
We randomly sampled 144 5-minute periods, resulting in almost 20M trades, from January through June 2025.
For each exchange and time period, select a trade.
If there’s another trade within 10 trades OR 5 seconds, on the opposite side, with nearly identical amounts at nearly identical price (<1%), mark both trades as a round-trip.
Repeat for each trade. If the trade is already marked as a round-trip, skip it.
Calculate the volume from trades marked as a round trip and divide it by the total.
Below, we plotted a sample of trades from a select few exchanges for a single time period, marking which trades are suspected round-trips. Each gray dot is a normal trade and each green and red mark are round-trip trades.
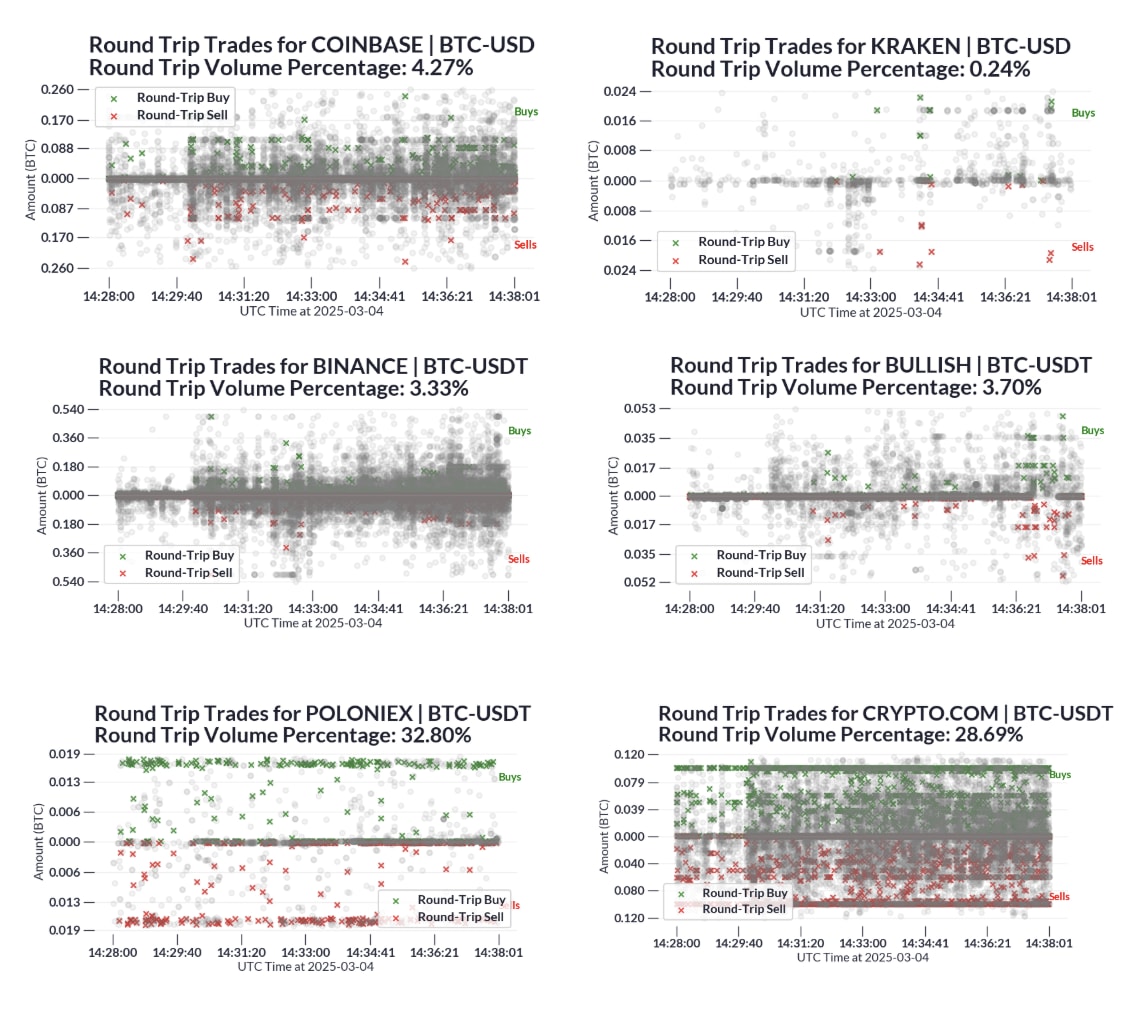
Source: Trusted Exchange Framework
Due to the approximate nature of this method, we expect some false positives of round trip trades that are the result of normal market activity (e.g., market makers facilitating trading by providing liquidity on both sides of the orderbook). However, a high percentage of round trip trades relative to the industry baseline as shown by Crypto.com and Poloniex, raises concerns about the reliability of their reported volume figures.
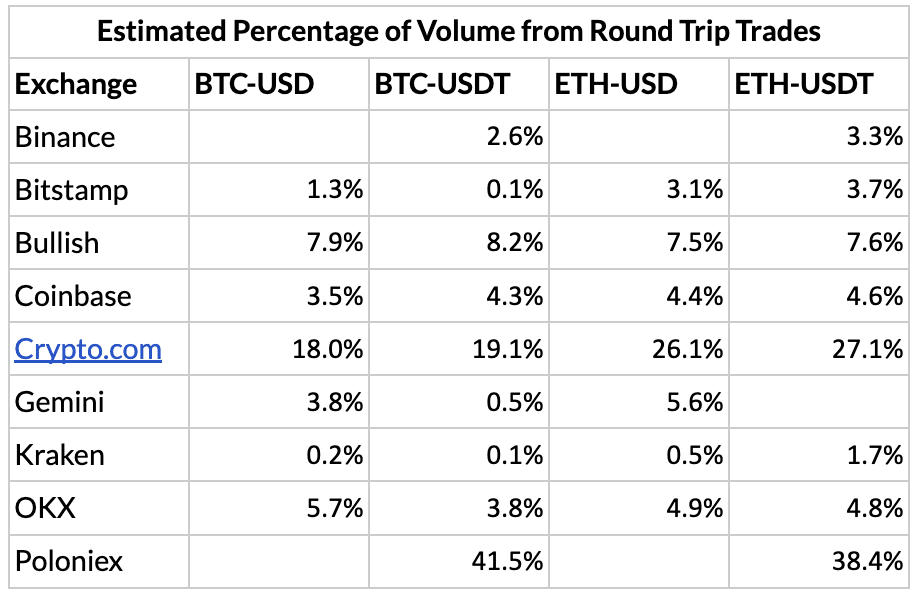
To put this in perspective: In Q1-Q2 2025, we estimate that Crypto.com had a trading volume of about $720B from BTC-USD ($201B), BTC-USDT, ($192B) ETH-USD ($165B), and ETH-USDT (160B). Using the estimated percentages above, we estimate that $160B of the volume from those pairs come from round trips.
Conclusion
With several crypto exchange companies soon to go public, it’s in the best interest of the investing public to be knowledgeable about the relative qualities of these venues. While trading volume can help estimate transaction revenues, which still make up the majority of revenue, qualitative factors like business diversification, presence of wash-trading, and regulatory compliance are also important considerations for assessing exchange quality. These inputs can help market participants assess whether valuations are fair.
Coinbase continues to lead the way four years after its IPO, largely due to its success in diversifying revenue streams into custody, stablecoin, and Layer-2 fees. But, competition in the exchange market is intensifying. For other exchanges to compete, they must diversify their revenues beyond trading-related fees, which is highly cyclical with market sentiment. As we move towards a more defined market structure, exchanges are being given permission to evolve beyond trading venues into full-scale super-apps. How these exchanges capitalize on that opportunity and whether they deliver on their visions and match the success of past breakthrough IPOs will be a lucrative development to track in the next year.
Coin Metrics Updates
This week’s updates from the Coin Metrics team:
Follow Coin Metrics’ State of the Market newsletter which contextualizes the week’s crypto market movements with concise commentary, rich visuals, and timely data.
As always, if you have any feedback or requests please let us know here.
Subscribe and Past Issues
Coin Metrics’ State of the Network, is an unbiased, weekly view of the crypto market informed by our own network (on-chain) and market data.
If you'd like to get State of the Network in your inbox, please subscribe here. You can see previous issues of State of the Network here.