

The market is currently at a sensitive juncture, with price levels around $112,600 and signals from the RSI creating two clear scenarios.
One is a “profit-taking” move that pulls the price back to the $95,000 zone if technical selling pressure increases and historical patterns repeat (which remain unverified). Two is a “bullish rebound” toward the $119,000 area if the current bottom holds and a bullish divergence is confirmed.
Technical Signals Creating Short-Term Market Sentiment Divergence
Bitcoin (BTC) is facing two opposing scenarios shaped by momentum indicators, with the RSI (Relative Strength Index) at the center across multiple timeframes. According to analyst Ali, the last two times, the weekly RSI dropped below the 14-period SMA. As a result, Bitcoin corrected between 20% and 30%.
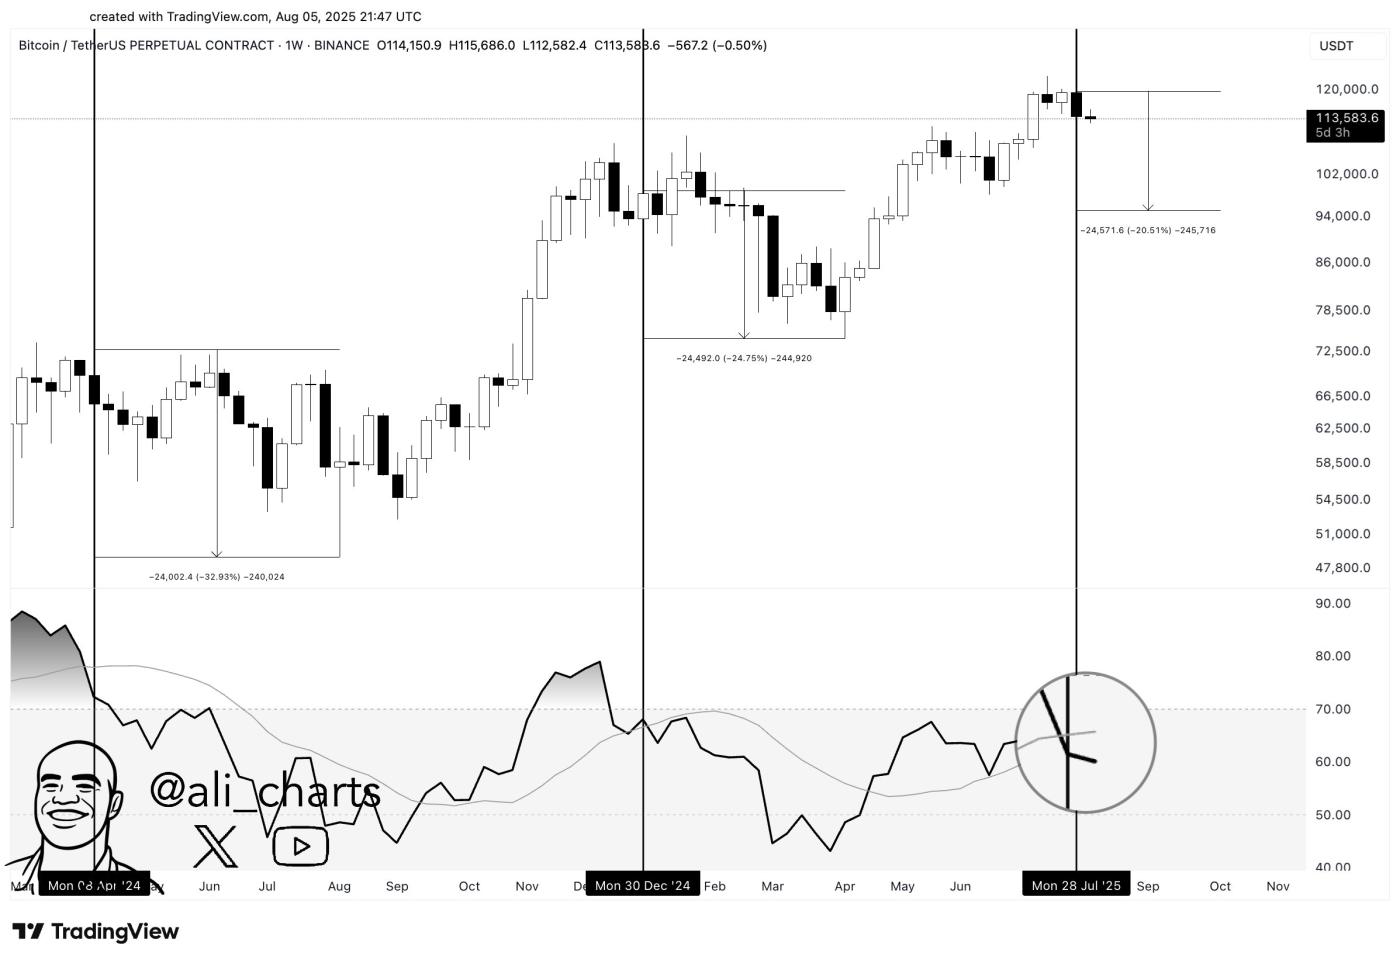 Bitcoin RSI Analysis. Source: Ali
“If history repeats, we could see a move down to $95,000!” Ali commented.
In a previous analysis, Arthur Hayes predicted a sharp correction in the cryptocurrency market. He predicted Bitcoin to hit $100,000 and Ethereum to hit $3,000.
Continuing to observe the RSI, on the daily chart, analyst Sykodelic noted that the RSI is now at a level similar to the previous bottom around ~$98,000 and close to the low seen at ~$76,000. This suggests that short-term selling pressure has weakened, and the current region could be an accumulation point.
From another perspective, analyst Caleb Franzen pointed out that Bitcoin has broken through the lows identified by a bullish RSI divergence. When price makes lower lows but RSI does not follow suit (bullish divergence), it signals weakening downward momentum. Conversely, a bearish divergence occurs when the price rises but RSI falls, warning of a potential downward reversal.
Given this setup, Caleb believes the move could pave the way for a rebound toward $119,000. At the same time, this level becomes a critical threshold; breaking below would invalidate the bullish scenario.
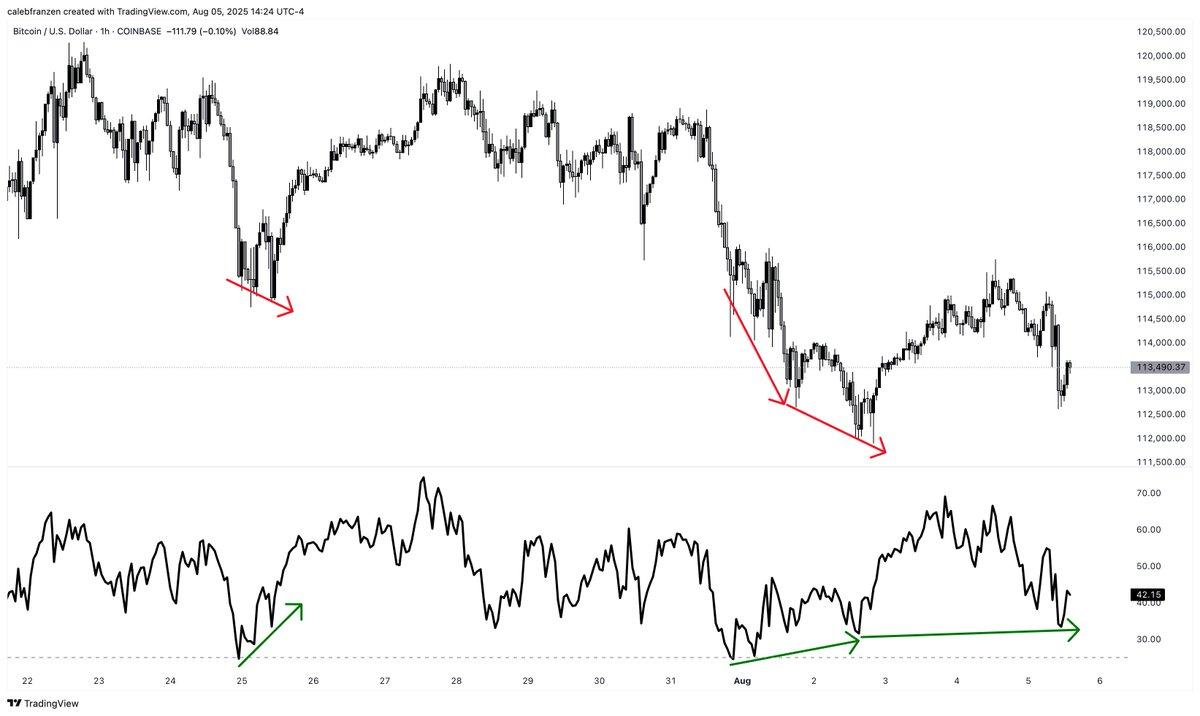 Potential BTC Rebound Scenario to $119,000. Source: Caleb Franzen
In this context, a decline to $95,000 could serve as a “reset phase” to reaccumulate buying power. On the other hand, the $112,600 support zone is currently seen as a crucial level to maintain the rebound outlook.
If the price holds this area, along with confirmation of bullish divergence on the RSI, a bounce back to the $119,000 zone would have technical merit. Further confirmation from volume, moving averages, and daily closes above key thresholds is required. This confirmation helps mitigate the risk of false signals.


