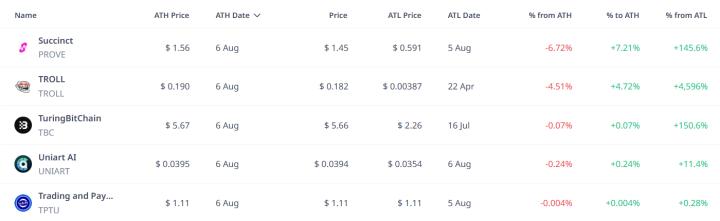
Succinct's PROVE Token has been listed on major global exchanges a few hours ago and is already attracting attention with significant volatility. After opening at around $0.65, excluding the first candle's low point, the token surged to over $1.5 and has now returned to near $1.2.
This is a substantial volatility for a new listing, and initial indicators suggest that breaking one level could prepare for recovery or collapse.
Cliff Unlock Delay... Large Holders Early Entry
One of the biggest fears for a newly listed token is the cliff unlock where large amounts of tokens are released to insiders and early supporters, often causing a sharp price drop. However, in Succinct's case, the structure tells a different story.
According to the official distribution, over 65% of the total supply allocated to core contributors, investors, and R&D will have 0% unlock at TGE, a 12-month cliff, and gradual linear vesting over 36-48 months. Incentive and foundation allocations will also be partially unlocked at launch but follow the same one-year cliff schedule before additional supply reaches the market.
This means there will be no meaningful unlock pressure until mid-2026, giving the market sufficient time to absorb initial token issuance or liquidity and organically establish demand.
Token Technical Analysis and Market Update: Want more such token insights? Subscribe to editor Harsh Notariya's daily crypto newsletter here.
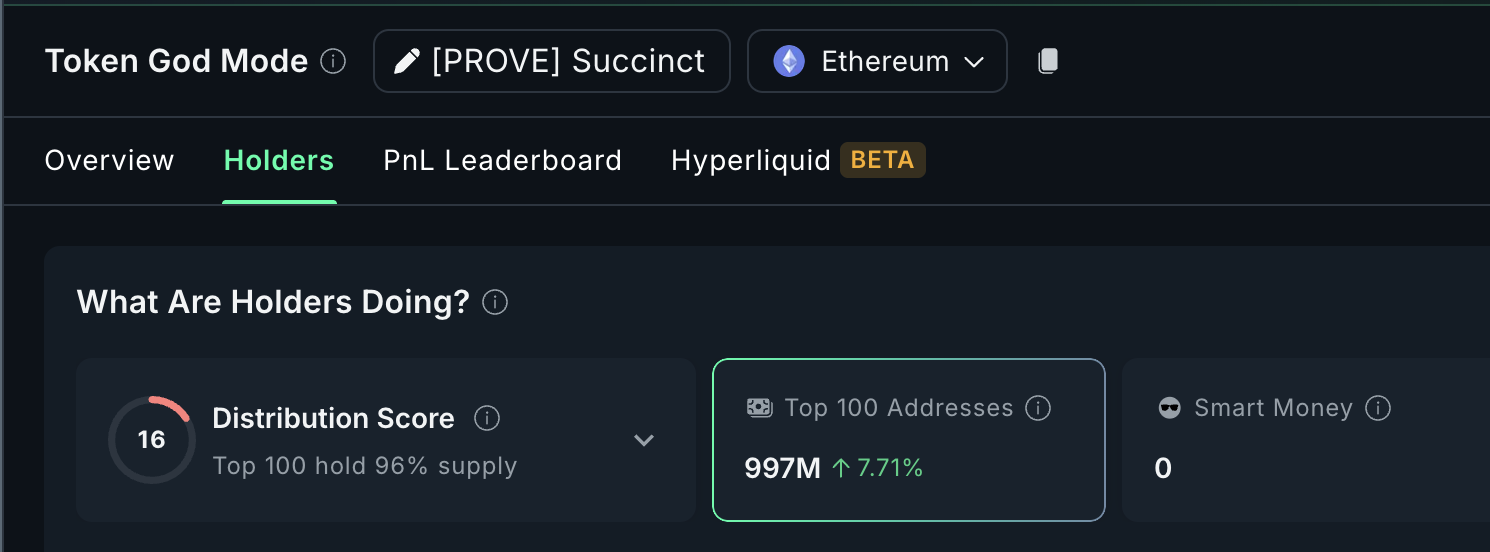
Now for the more interesting part. Despite initial volatility, the top 100 holders have added 7.71% more tokens, holding 96% of total supply. This increase in ownership concentration indicates ongoing initial accumulation. This suggests long-term participants like insiders or whales anticipate the strength of Succinct's token model.
With most token supply locked by a cliff and major holders quietly accumulating, the risk of short-term supply shock is minimized. Current trading occurs in low liquidity, and price movements are more sensitive to momentum and sentiment.
$1.18, Succinct (PROVE) Price Watershed
The 1-hour chart tells a classic retracement story. After nearly reaching $1.55, PROVE neatly retraced to around $1.14 and is currently hovering near $1.23. Importantly, this area aligns with the anchored VWAP (Volume Weighted Average Price) line at $1.21, where price has found support multiple times.
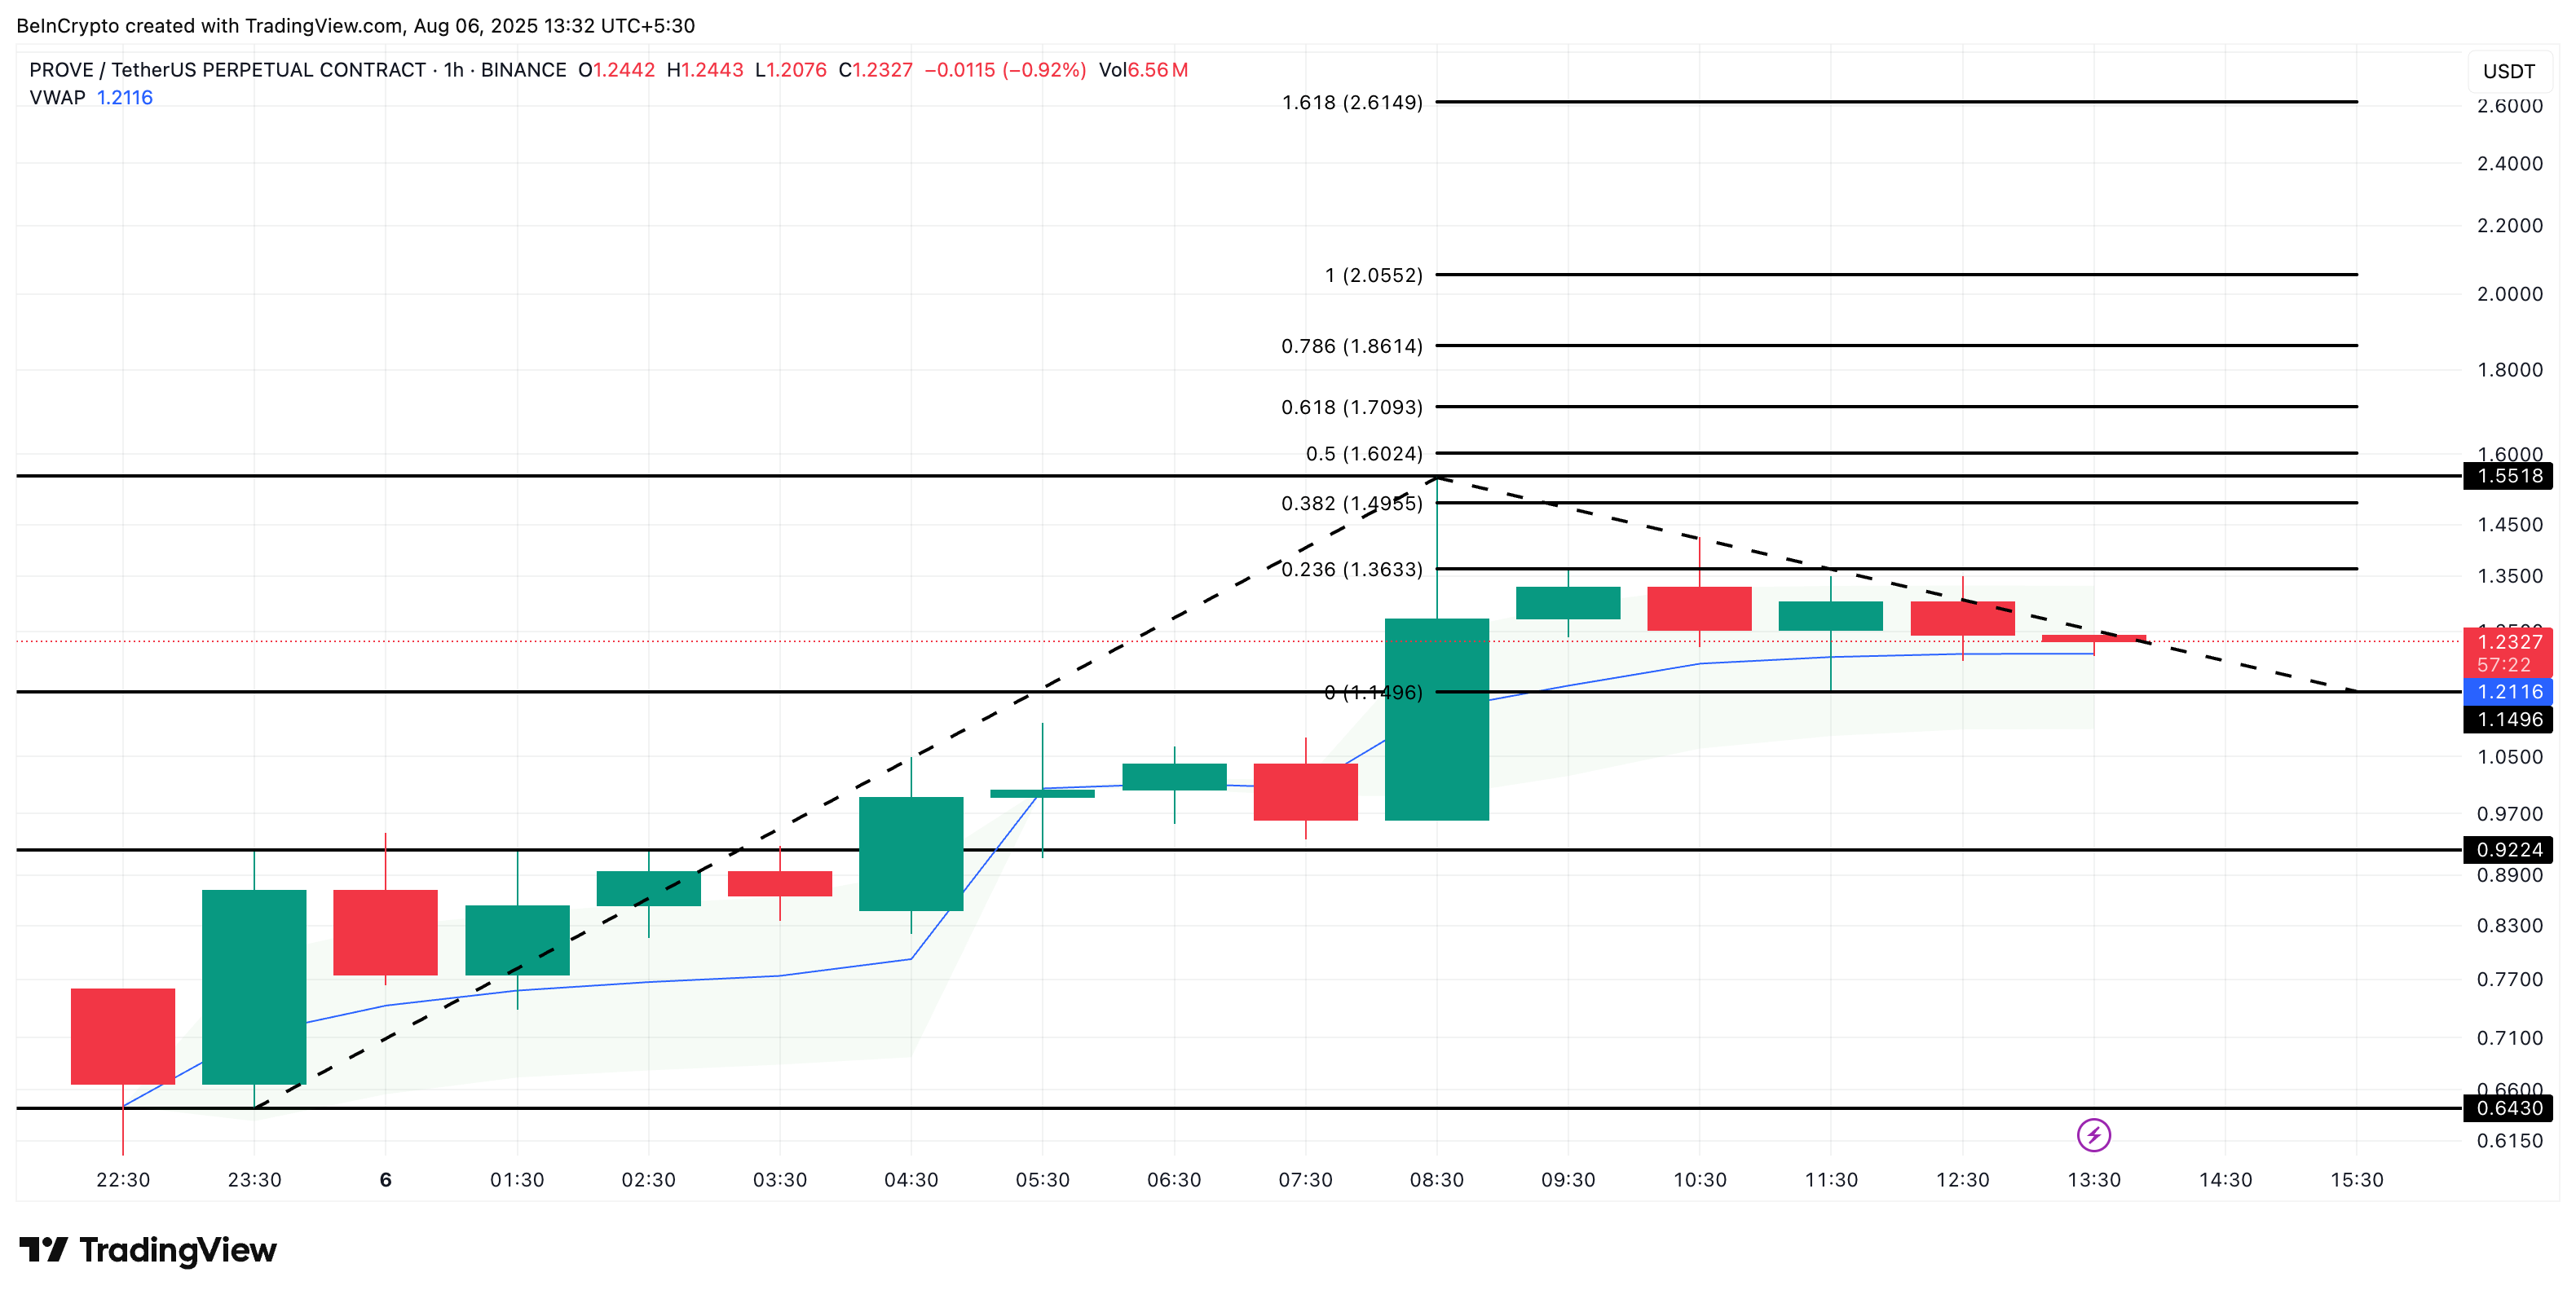
If the VWAP line (blue line) breaks, the next major supports are at $1.14 and $0.92. Falling below the latter risks forming a new all-time low (below $0.64) and completely invalidating the short-term upward structure.
Note: The first candle on the left is excluded due to listing volatility from the Fibonacci expansion low point.
VWAP is a popular intraday indicator traders use to assess whether a token is trading at a premium or discount to its daily average price. Price staying above VWAP generally suggests buyers are in control short-term. In this case, PROVE maintaining above VWAP adds a support layer below the current range.
However, if PROVE breaks above $1.36 and $1.49, the 0.618 Fibonacci level at $1.70 opens as the next target. This trend-based Fibonacci expansion pattern can continue to fluctuate as PROVE is still experiencing post-listing volatility.
15-Minute Chart Bullish Flag Forming... 9/15 Moving Average Crossover Not Yet
Zooming into the 15-minute chart, a textbook ascending flag is forming. Lower highs are converging with higher lows in a symmetric triangle. This pattern typically resolves in the direction of the existing trend, here rising from the $1.58 breakout zone.
If Succinct (PROVE) price breaks $1.49 (on the 1-hour chart), this signifies a flag breakout. However, a clear trend-based breakout level is above $1.61, which also aligns with the previous 1-hour Fibonacci chart.
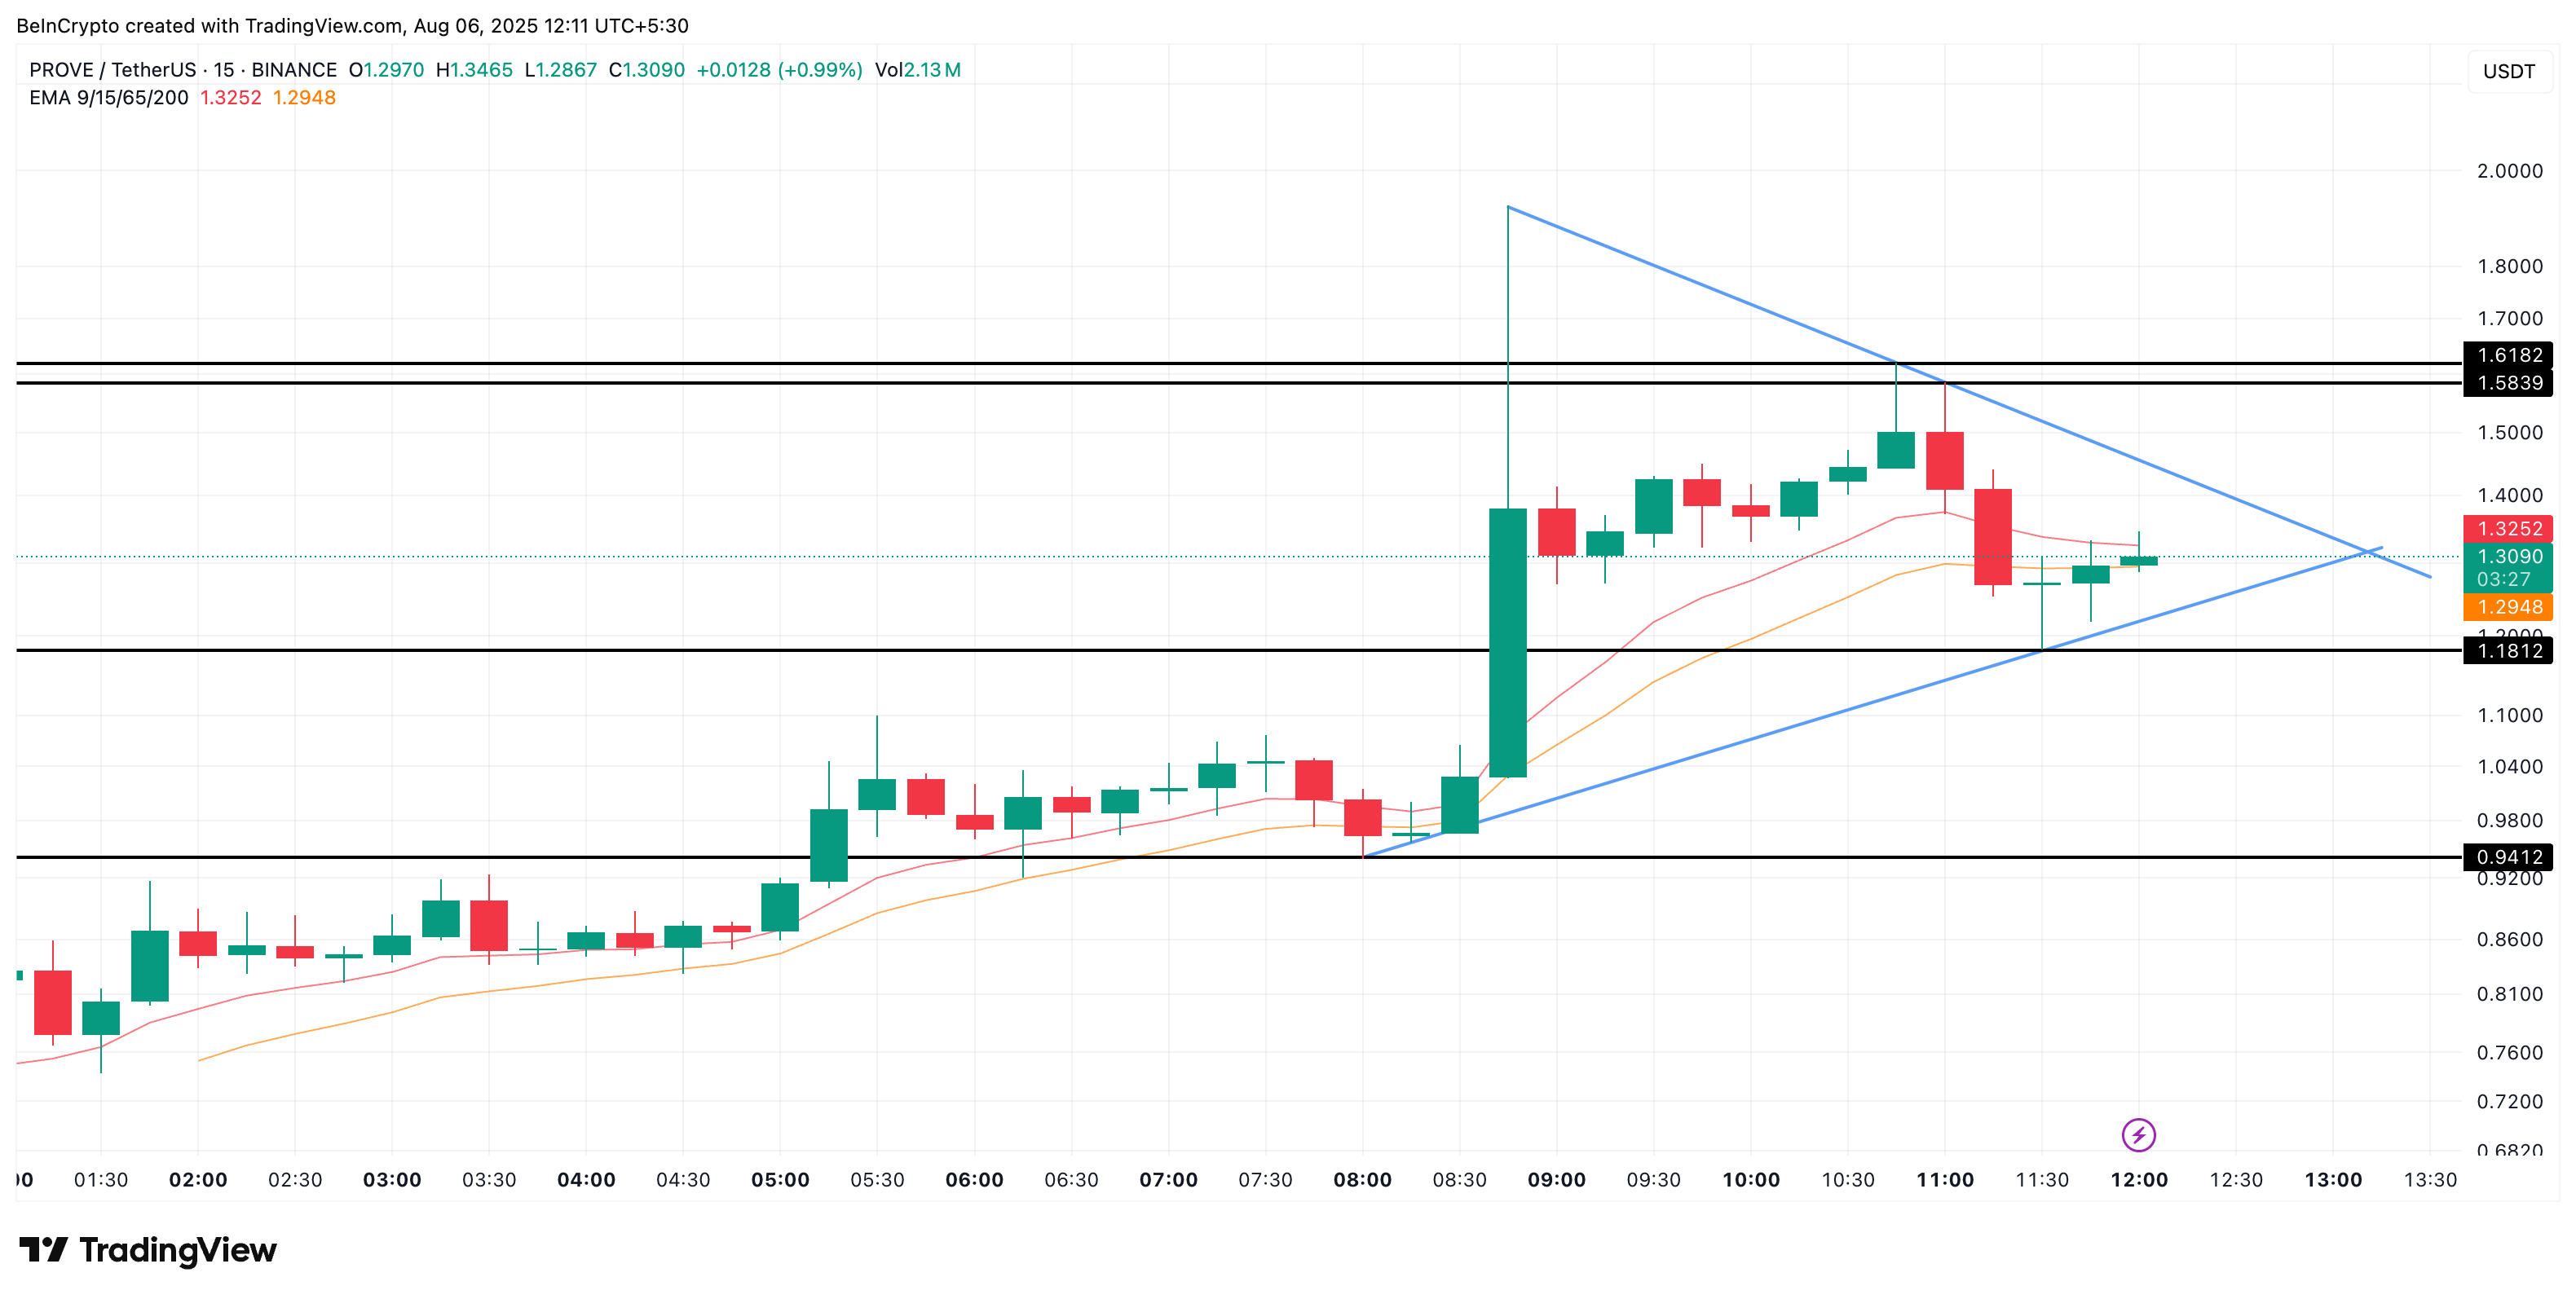
However, there's a small caveat. The 9 moving average is approaching the 15 moving average but hasn't crossed it yet. Until this crossover is confirmed, momentum remains neutral short-term.
If the crossover occurs and price breaks above the upper flag line at $1.49, a short-term rally could be triggered. This would push the price to $1.61 or higher. Conversely, if the pattern breaks down and $1.18 is breached, the risk of falling below $1 becomes a reality.