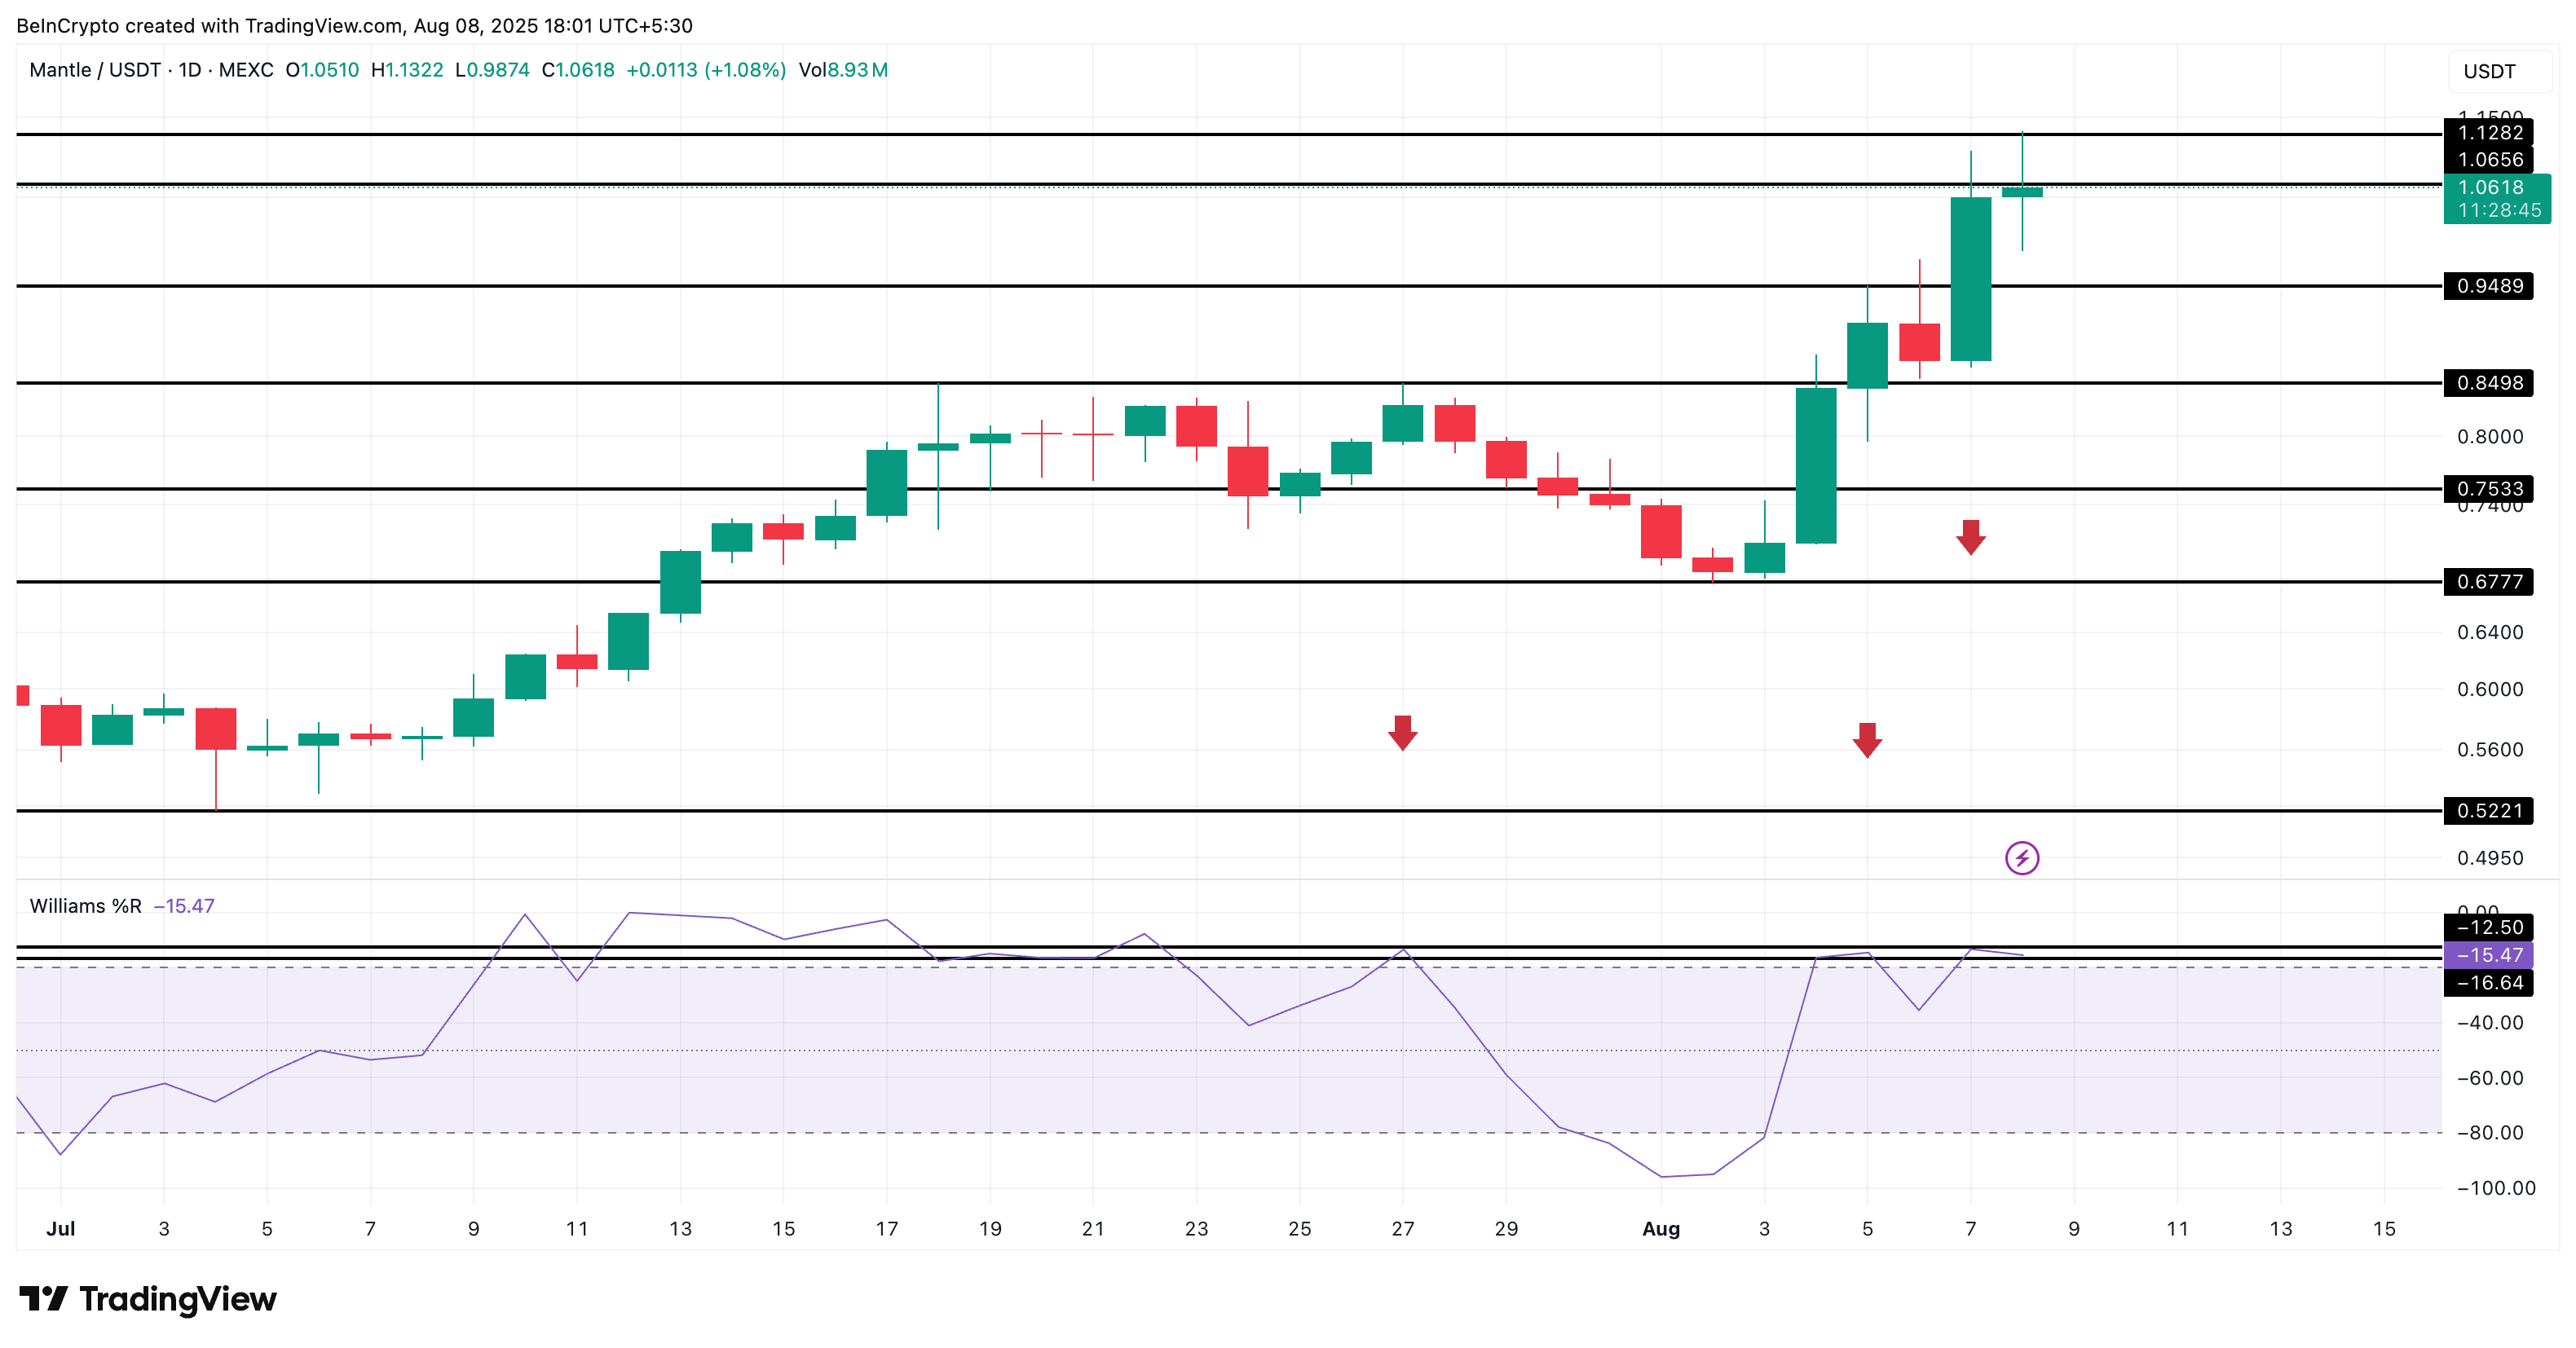
Mantle (MNT) has surged by more than 12% in just a few hours. Network activity increase and stablecoin liquidity surge were the driving forces. However, after approaching the major resistance zone near $1.12, the Mantle price momentum seems to be cooling down.
Short-term momentum is weakening, and there is a risk of price movement stagnating. However, according to on-chain data, buyers have not given up yet, at least until one major signal changes.
Net inflow negative... Buyers leading
Despite the recent MNT rally stopping, the net exchange flow has continued to be negative since its launch. This means that the amount of Token leaving exchanges is greater than the amount coming in. This is a strong signal that traders are still choosing to hold rather than sell. This trend has been maintained even after the recent 12% surge, showing that retail investors' confidence has not disappeared.

However, smart money wallets showed a caution signal. They sold 1.33 million MNT over the past 7 days, reducing their holdings by 3.76%, according to Nansen.

In contrast, the top 100 addresses added 2.48 million MNT. This suggests that large holders are still confident, despite some short-term smart money profit-taking.
This division could lead to a consolidation phase. If smart money continues to reduce positions and exchange outflows persist, we may see a sideways movement rather than a sharp correction. However, if profit-taking increases, inflows rise, and smart money continues to reduce positions, a deeper decline could be expected.
Token Technical Analysis and Market Update: Want more such token insights? Subscribe to editor Harsh Notariya's daily crypto newsletter here.
Mantle price rise... Momentum caution
Mantle (MNT) price has recorded several local peaks in recent weeks. This coincides with a surge in the Williams %R indicator, which helps identify whether an asset is in an overbought (value close to 0) or oversold (value close to -100) state.
On July 27, the Williams %R reached around -12, indicating a strong overbought state. Subsequently, the MNT price dropped sharply.

Between August 4-5, the Mantle price rose above $0.94 (local peak). The Williams %R also formed a local peak here, which was lower than the peak experienced on July 27. This suggests that MNT entered a consolidation phase rather than an immediate correction phase.
Now, after the recent rise on August 7, the Williams %R has returned near the level reached on July 27, creating a familiar setup. Similar figures appeared before more significant corrections.
The Williams %R is a fast-reacting momentum indicator that captures short-term overbought or oversold levels. Unlike RSI, it reacts faster to local peaks, making it ideal for tracking sharp rises like Mantle's.
If this pattern repeats, MNT may revisit $0.94 or $0.84 before the next major movement. However, if profit-taking begins and net flow turns positive (indicating tokens moving to exchanges), the correction could be steeper. A drop below $0.67 would invalidate the upward structure.
While the broader market sentiment is still bullish, these momentum changes suggest MNT may need to cool down temporarily. This is necessary before attempting a sustained break above $1.12.


