XRP's market momentum has slowed down since Friday, with trading activity decreasing and price movements stagnating.
The token, which showed some movement earlier this week, is now showing signs of reduced volatility and weakening demand, raising concerns about a potential downward turn.
XRP Trading Stagnation… Potential Seller Dominance
According to the readings on the XRP/USD daily chart, this altcoin has been moving within a narrow range over the past three trading days. Since Friday, XRP has faced resistance at $3.30 and found support at $3.22.
This comes after a rally from August 3rd to 7th, during which the token rose by 20%. The current sideways trend indicates reduced market volatility, reflecting a relative balance between buying and selling pressures.
At this stage, the market is often in "wait and see" mode, with traders waiting for a catalyst to determine the next price movement.
The decrease in volatility is also clearly evident in XRP's Average True Range (ATR), which has dropped by 10% since August 7th. The ATR measures the degree of price fluctuation over a certain period, and a declining ATR indicates a less volatile, more stable market condition.
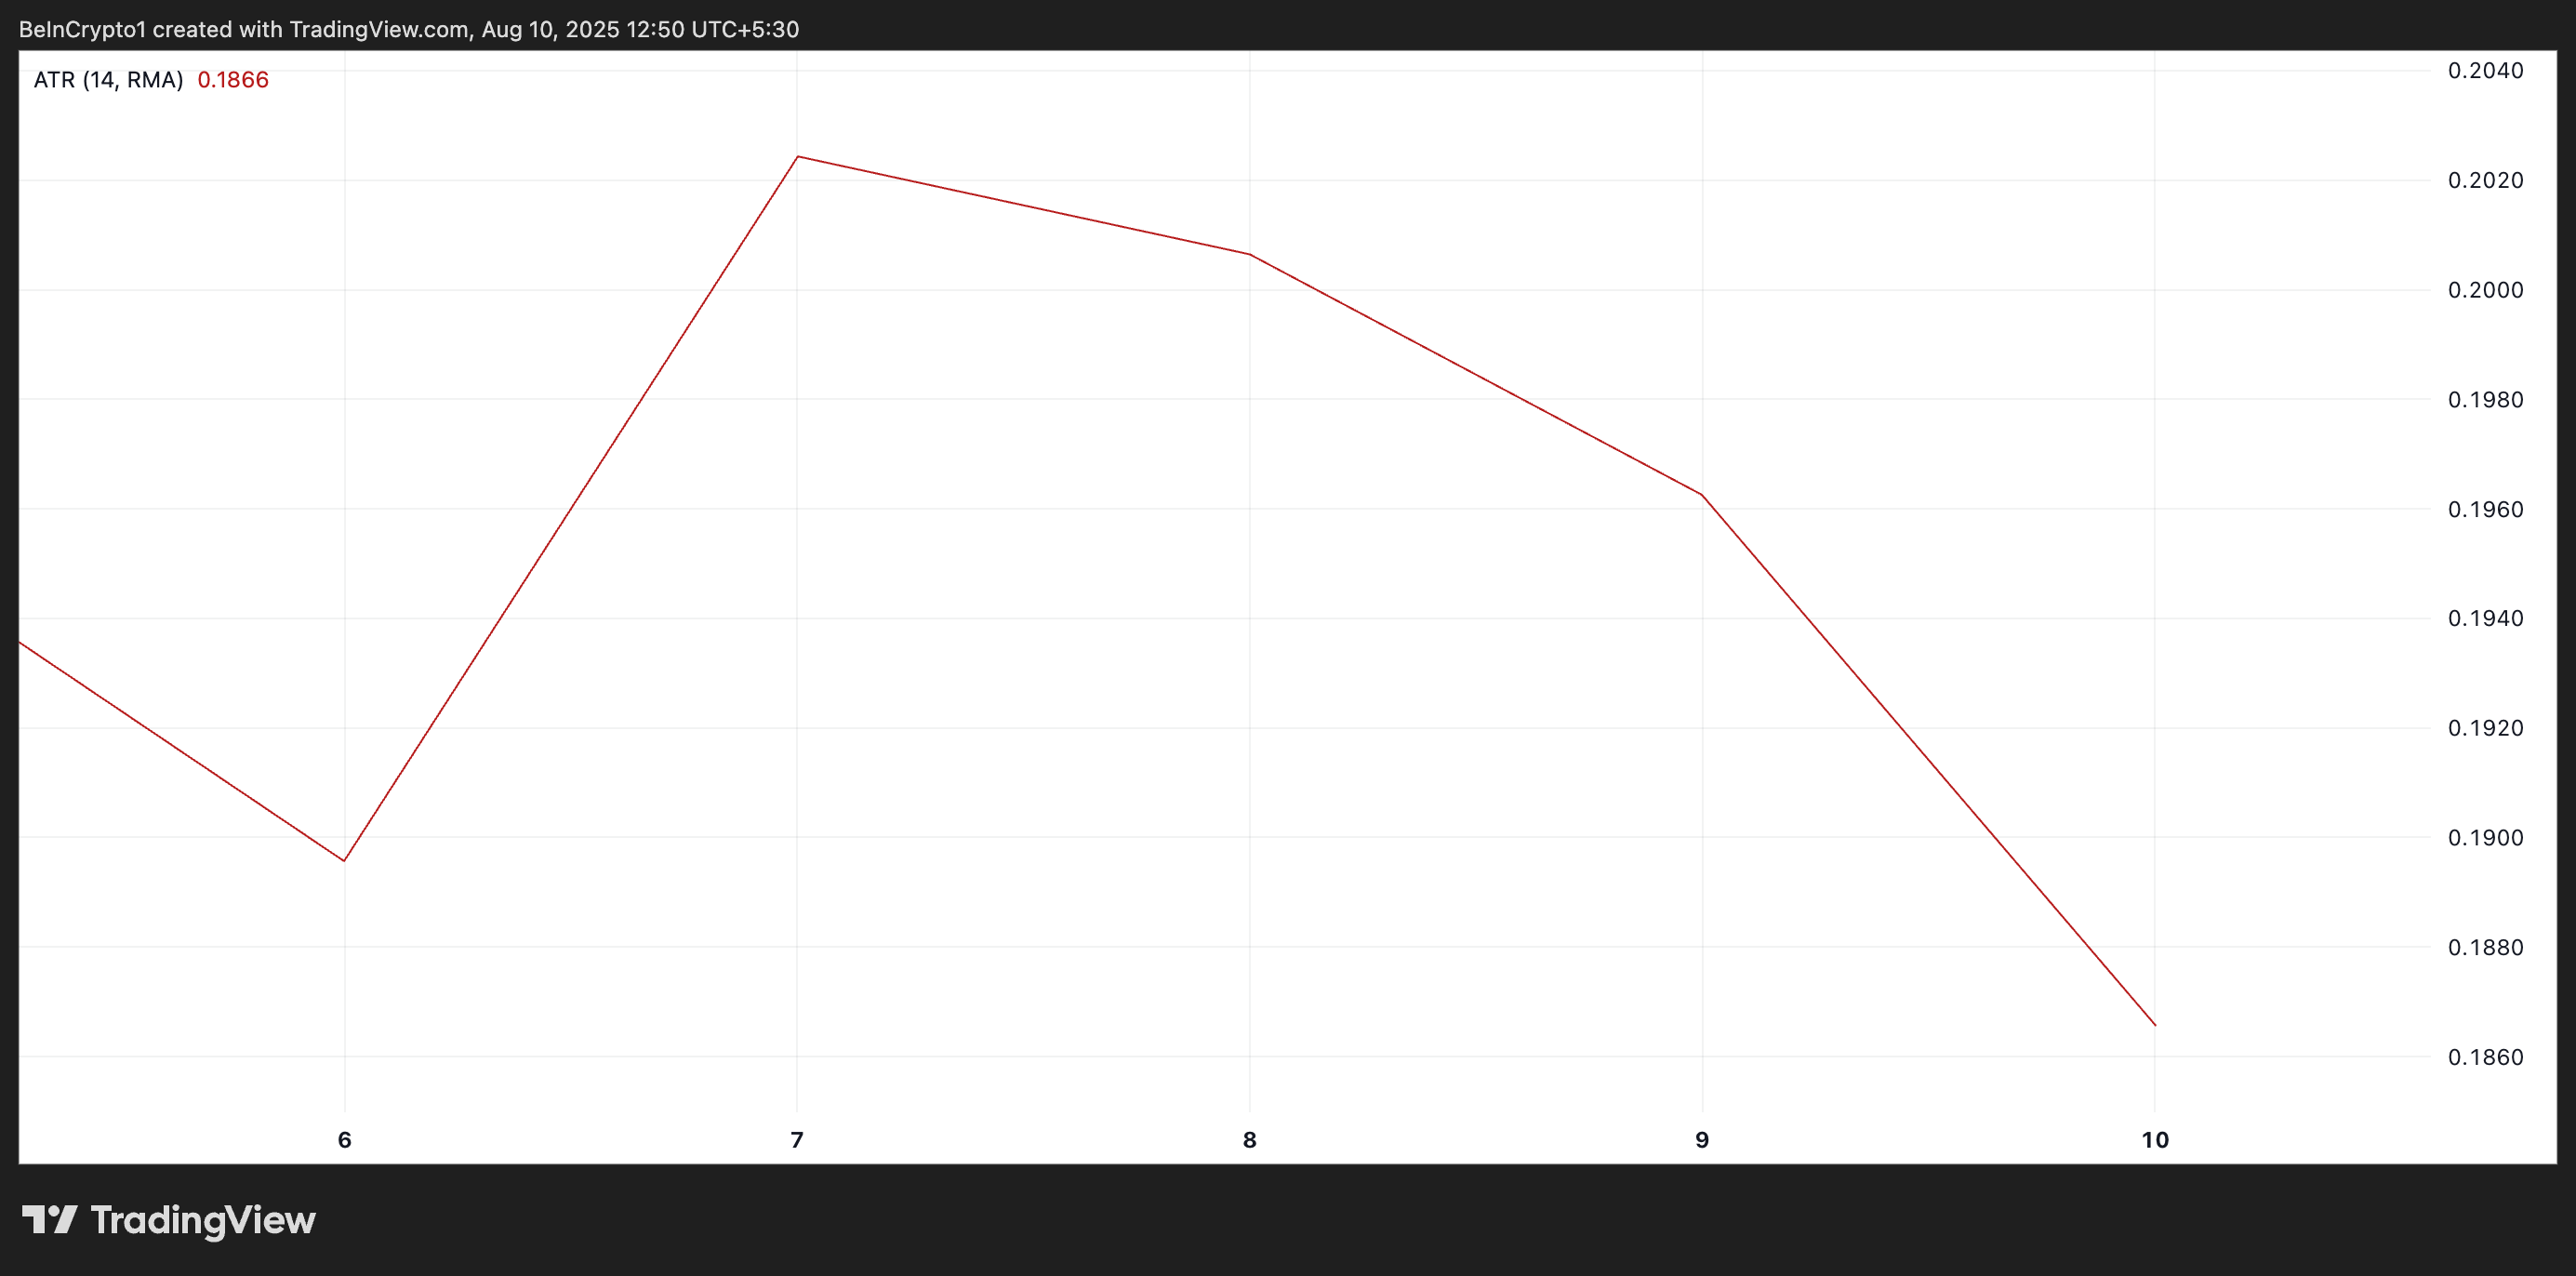
Periods of low volatility suggest market stability but can also mean reduced trader activity, which often precedes a sharp breakout in either direction.
Moreover, XRP's Elder-Ray Index reinforces the potential for a downward breakout. This indicator measures the strength of buyers (bullish force) and sellers (bearish force) by comparing price movements to moving averages.
On XRP's daily chart, the Elder-Ray Index has posted green histogram bars indicating bullishness, which have gradually decreased in size over the past few days.
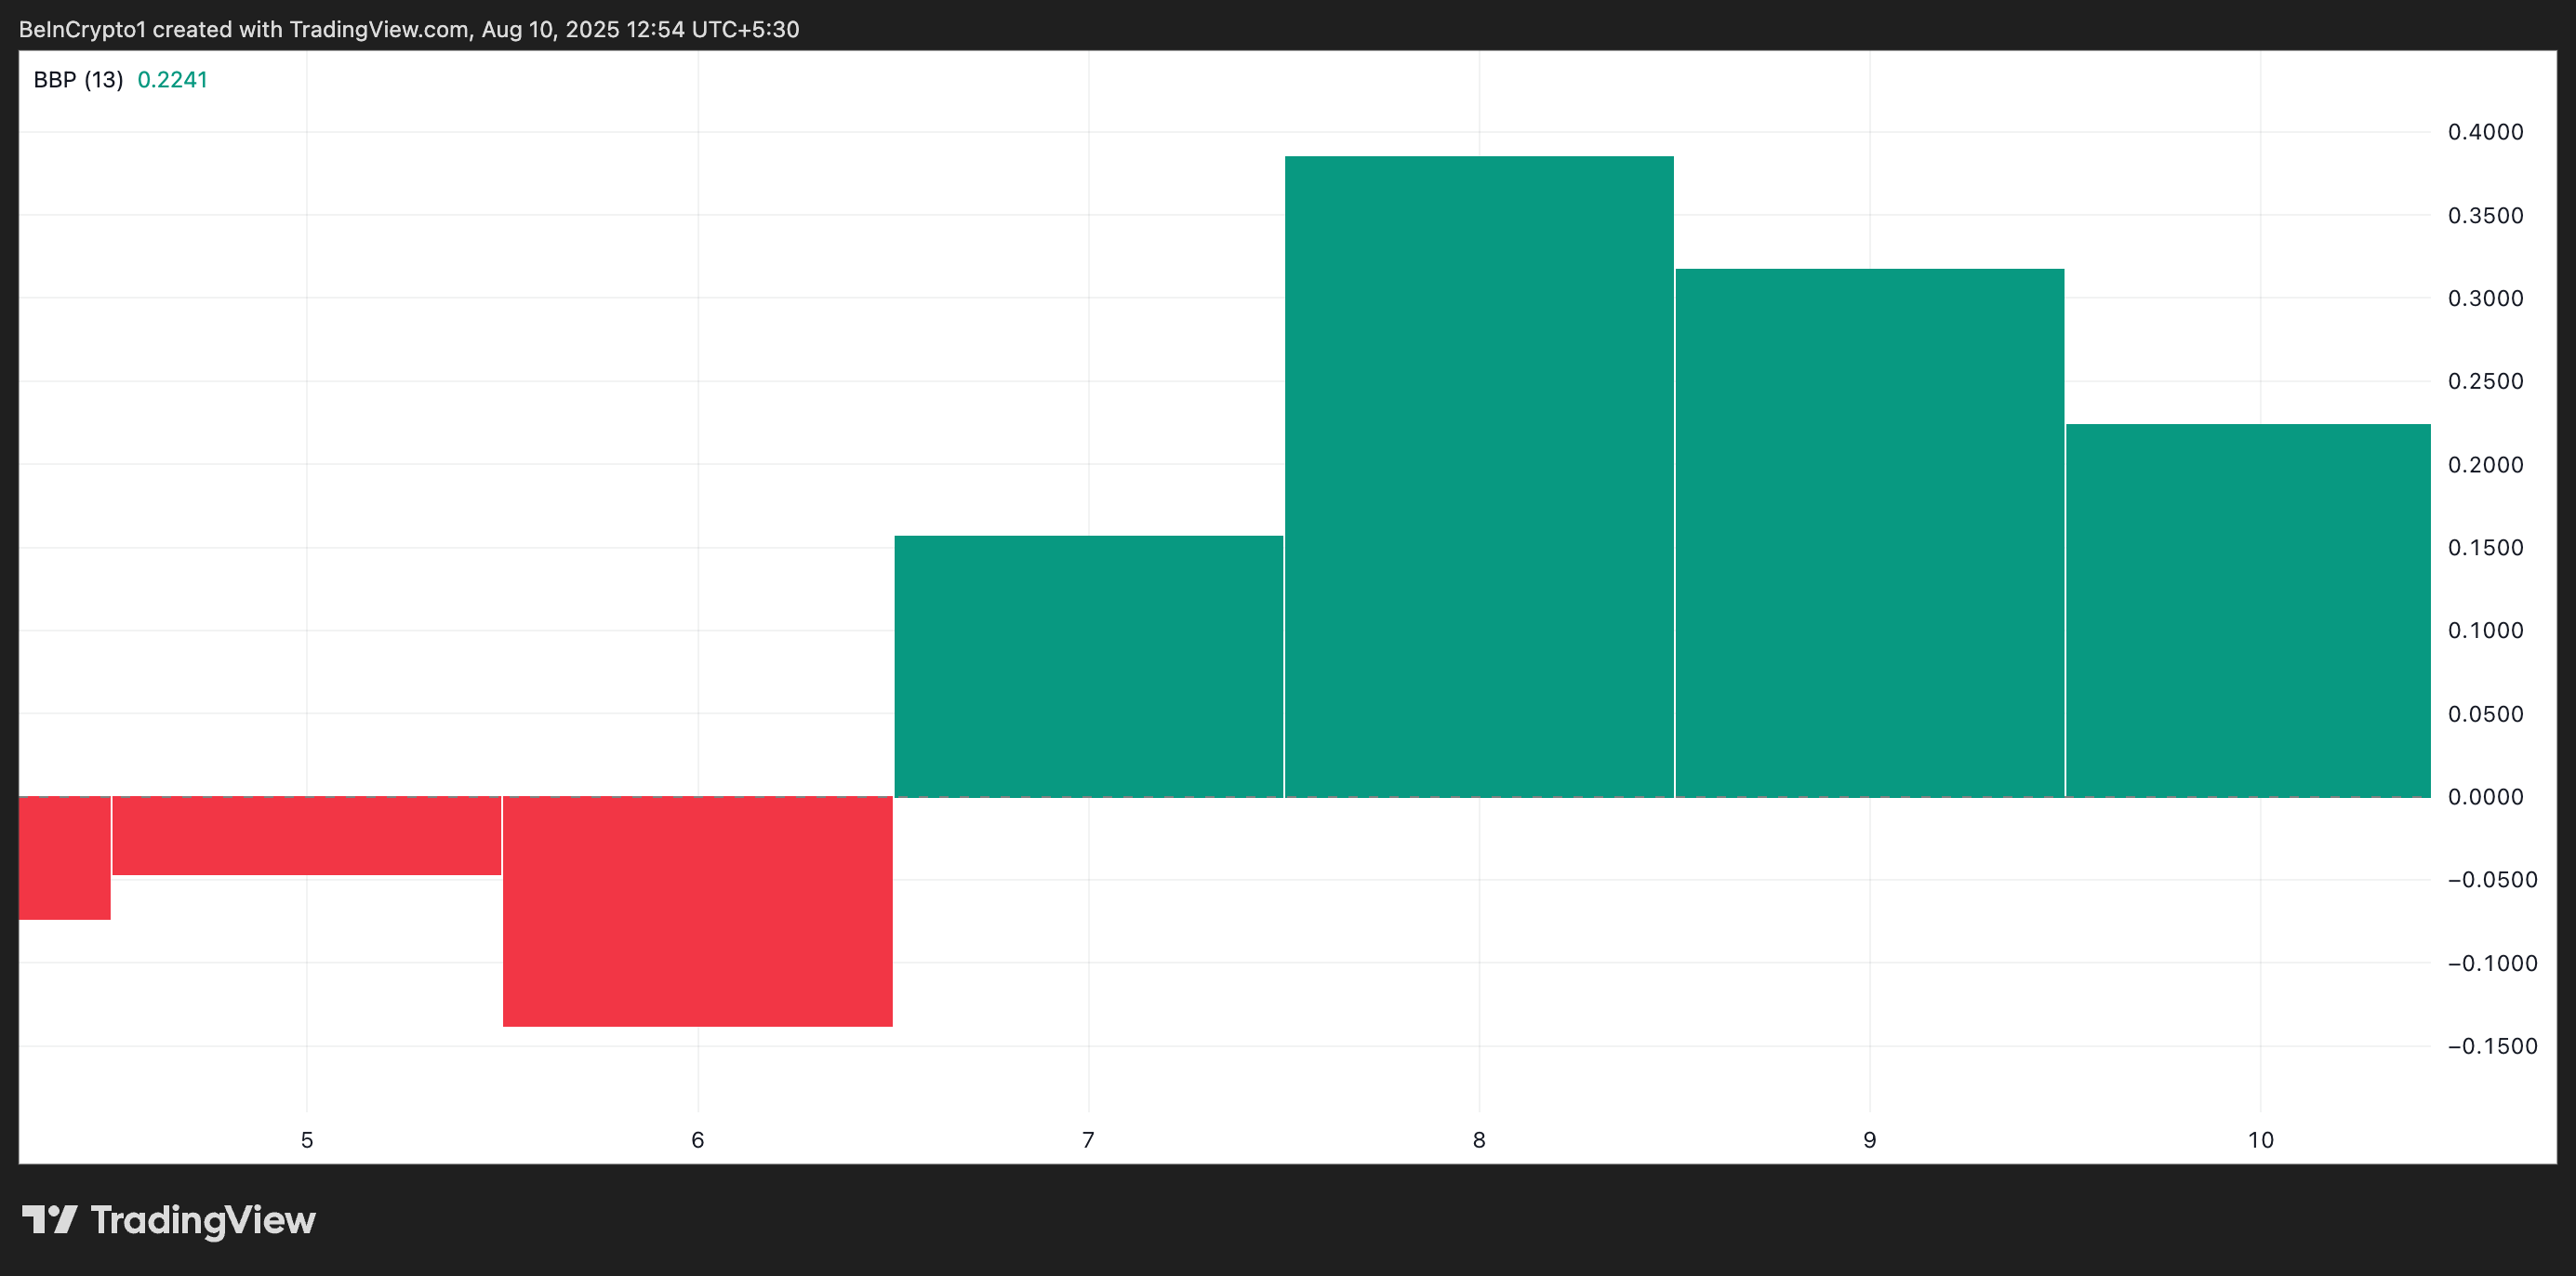
This contraction indicates a loss of buying momentum and creates an opportunity for sellers to assert control and potentially lower XRP's price.
XRP at Critical Juncture between $3.22 and $3.66
Strong selling pressure could trigger a breakdown below the $3.22 support. If this occurs, XRP's price could deepen its decline, potentially falling to $2.99.
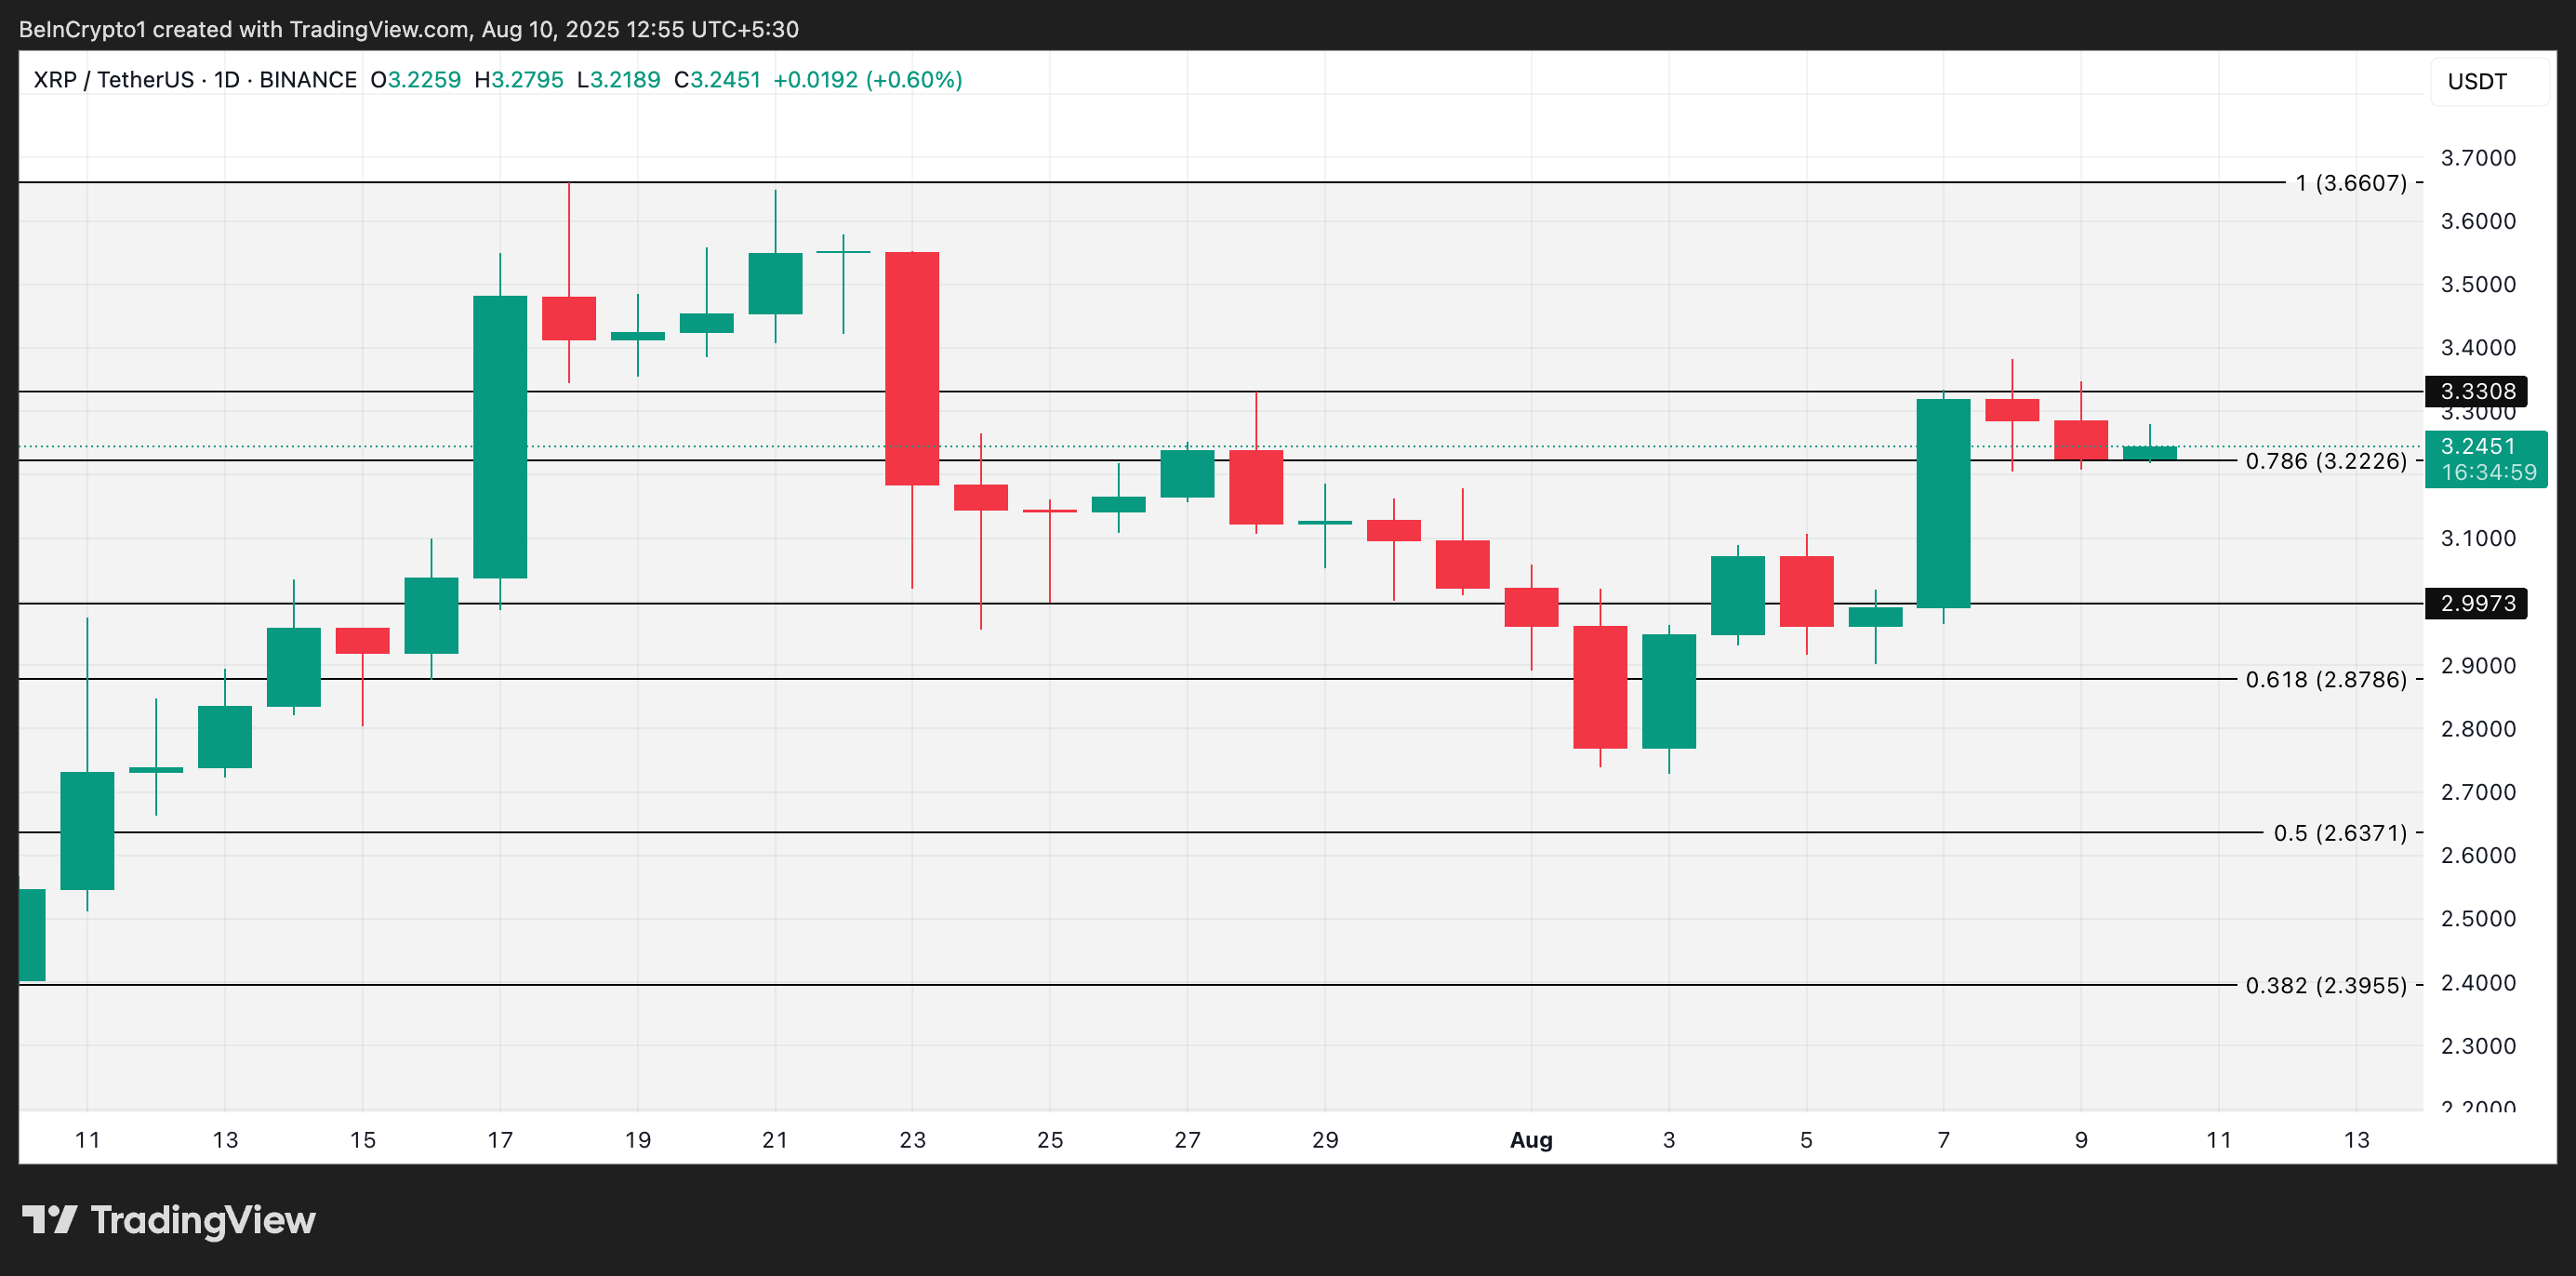
However, if new demand emerges, XRP could break through the price barrier at $3.33. A successful breakout could open the door to a rally towards $3.66.