Bitcoin price surged by about 7% last week. This is a significant movement even from the perspective of veteran investors with long cryptocurrency investment experience. The speed of this rally is being compared to the last rise just before the all-time high (ATH) of $122,838 on July 14th.
However, a detailed look at on-chain and technical indicators shows that the market conditions are noticeably different this time and may be more favorable for further increases.
SOPR, Rally Has Room
The Short-Term Holder Spent Output Profit Ratio (SOPR) measures whether coins moved on-chain are sold at a profit or loss. When the short-term SOPR becomes too high, it indicates aggressive profit-taking, which often occurs before local peaks.
The short-term holder SOPR is more meaningful in this analysis. This is because at aggressive price peaks, short-term holders are often the first to start selling.
Token TA and Market Update: Want more of these token insights? Subscribe to editor Harshi Notariya's daily crypto newsletter here.
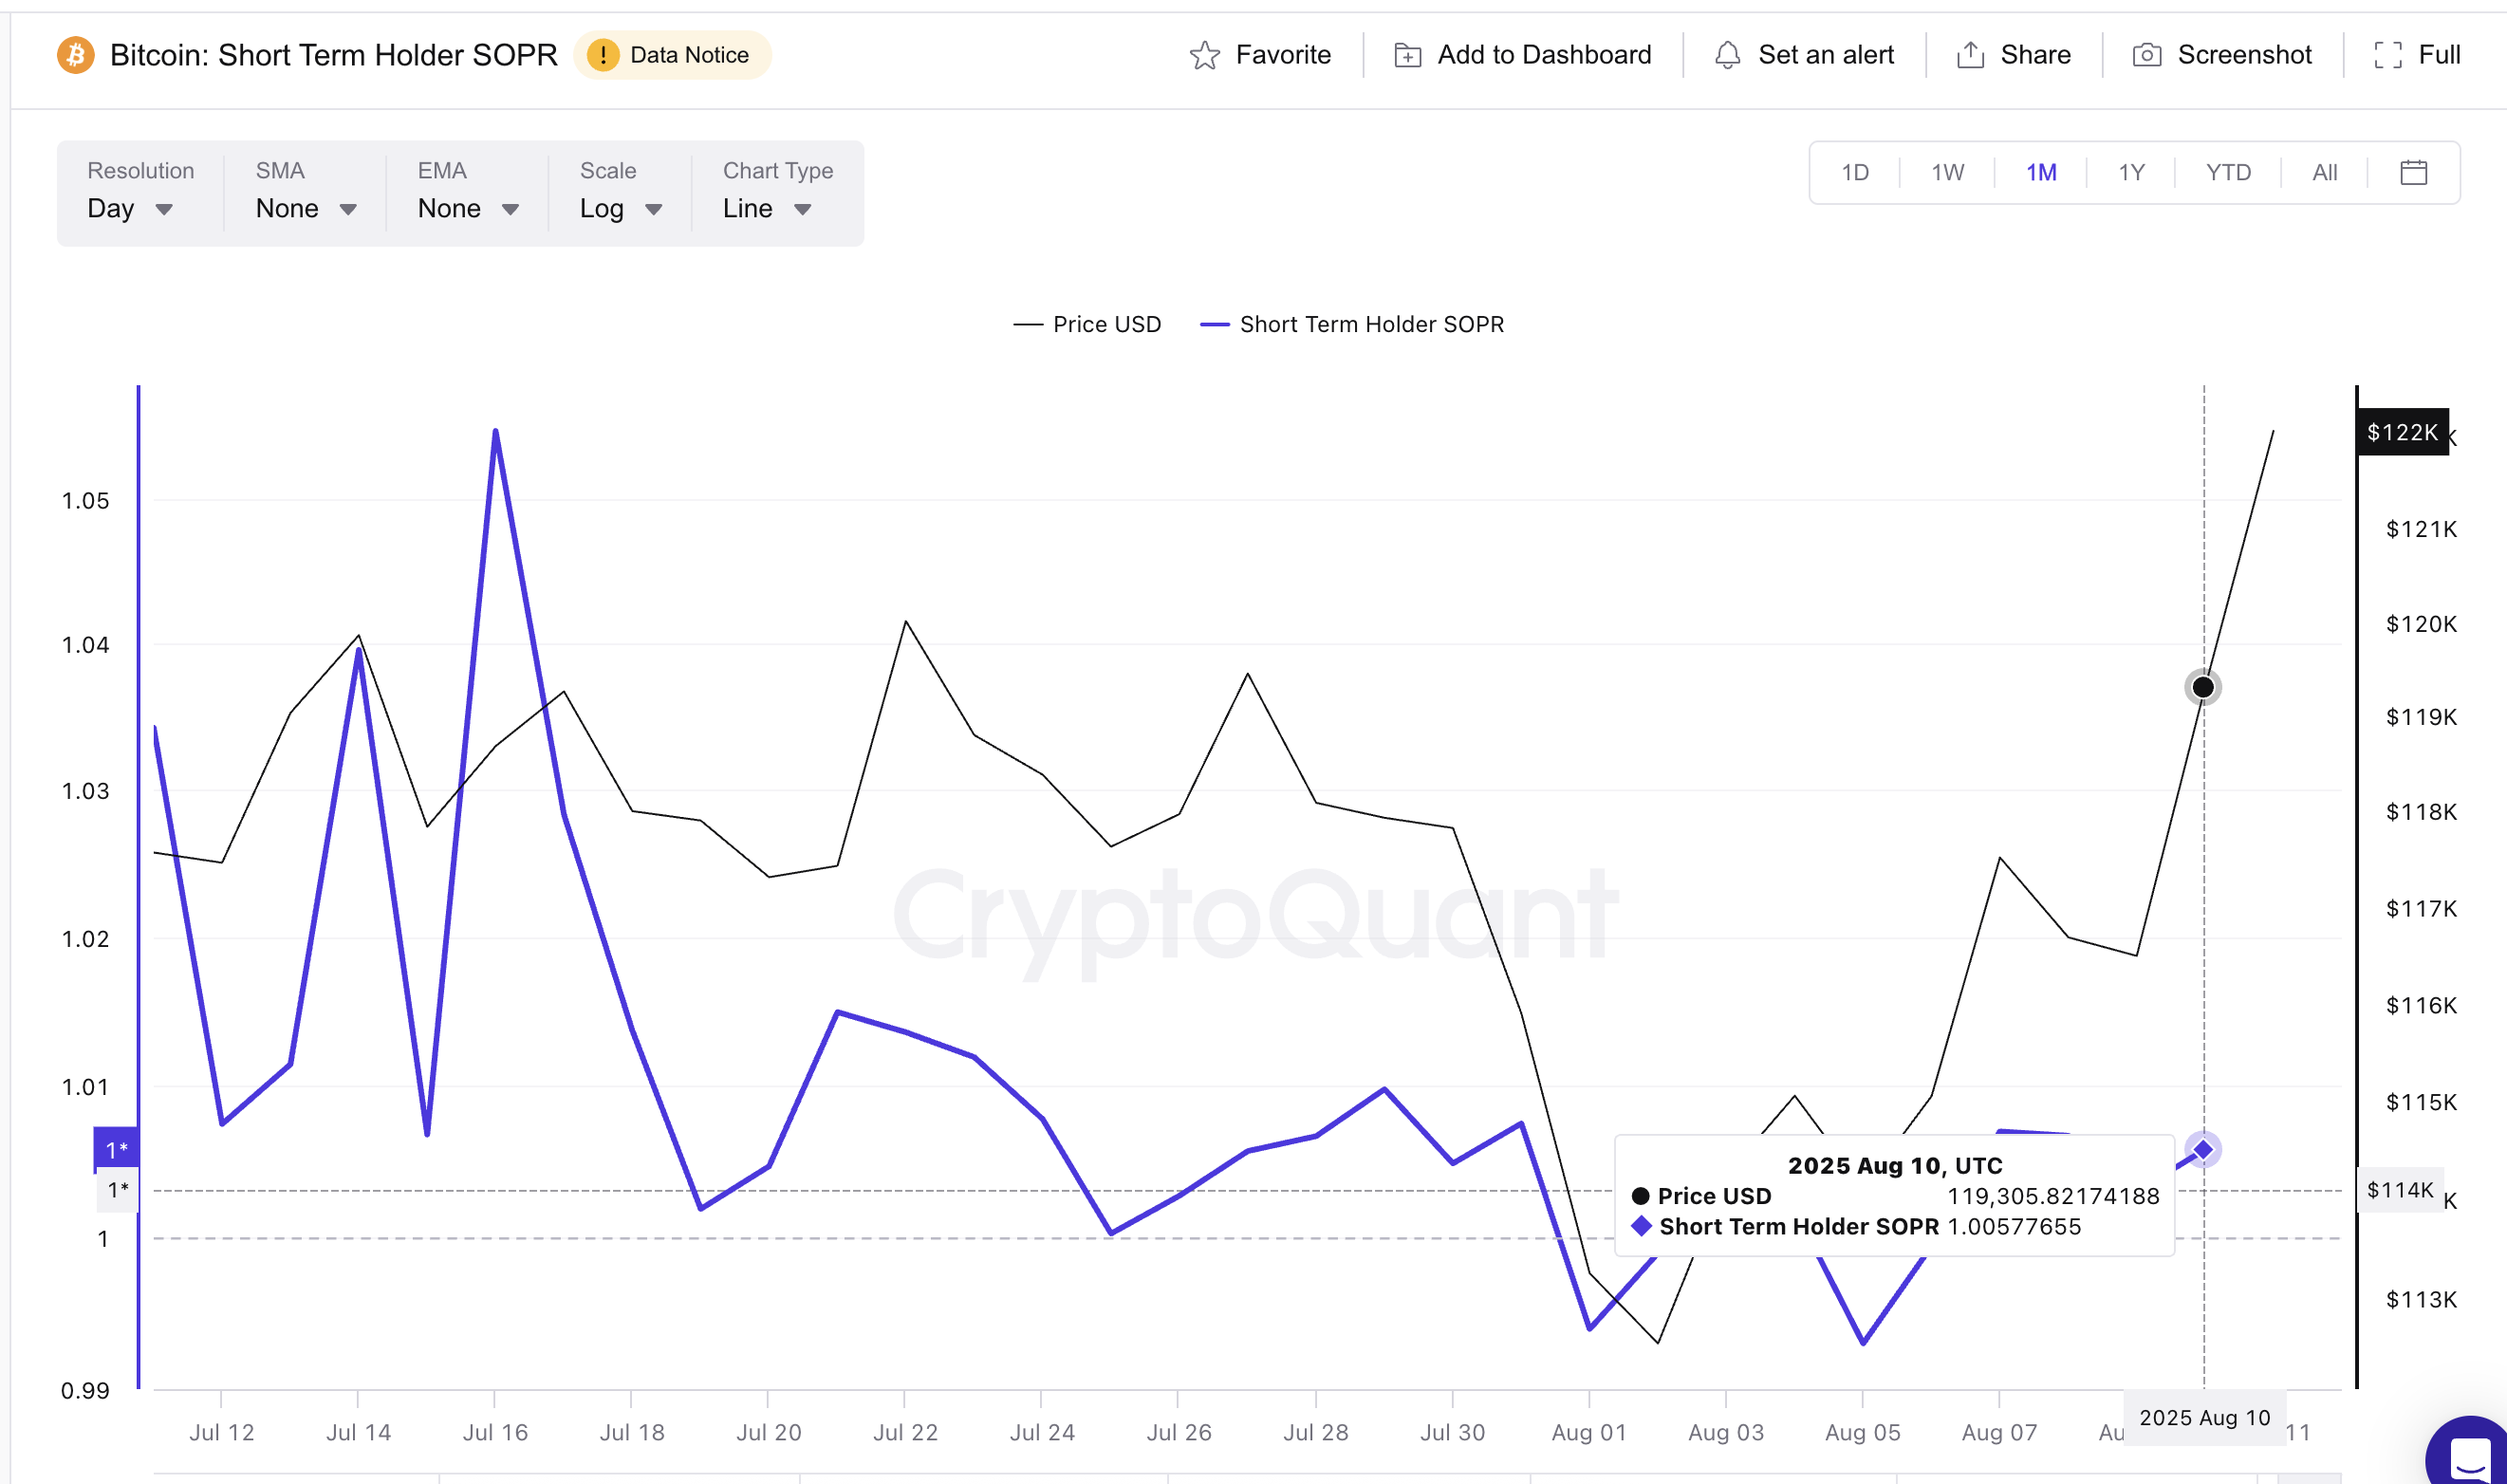
During the July 14th peak, SOPR surged to an overheated level between 1.03 and 1.05. This was a warning signal indicating that the Bitcoin price rally was exhausting itself. Currently, SOPR is located at 1.00, showing less aggressive profit-taking. This suggests a healthier market structure and a rally that has not yet reached saturation.
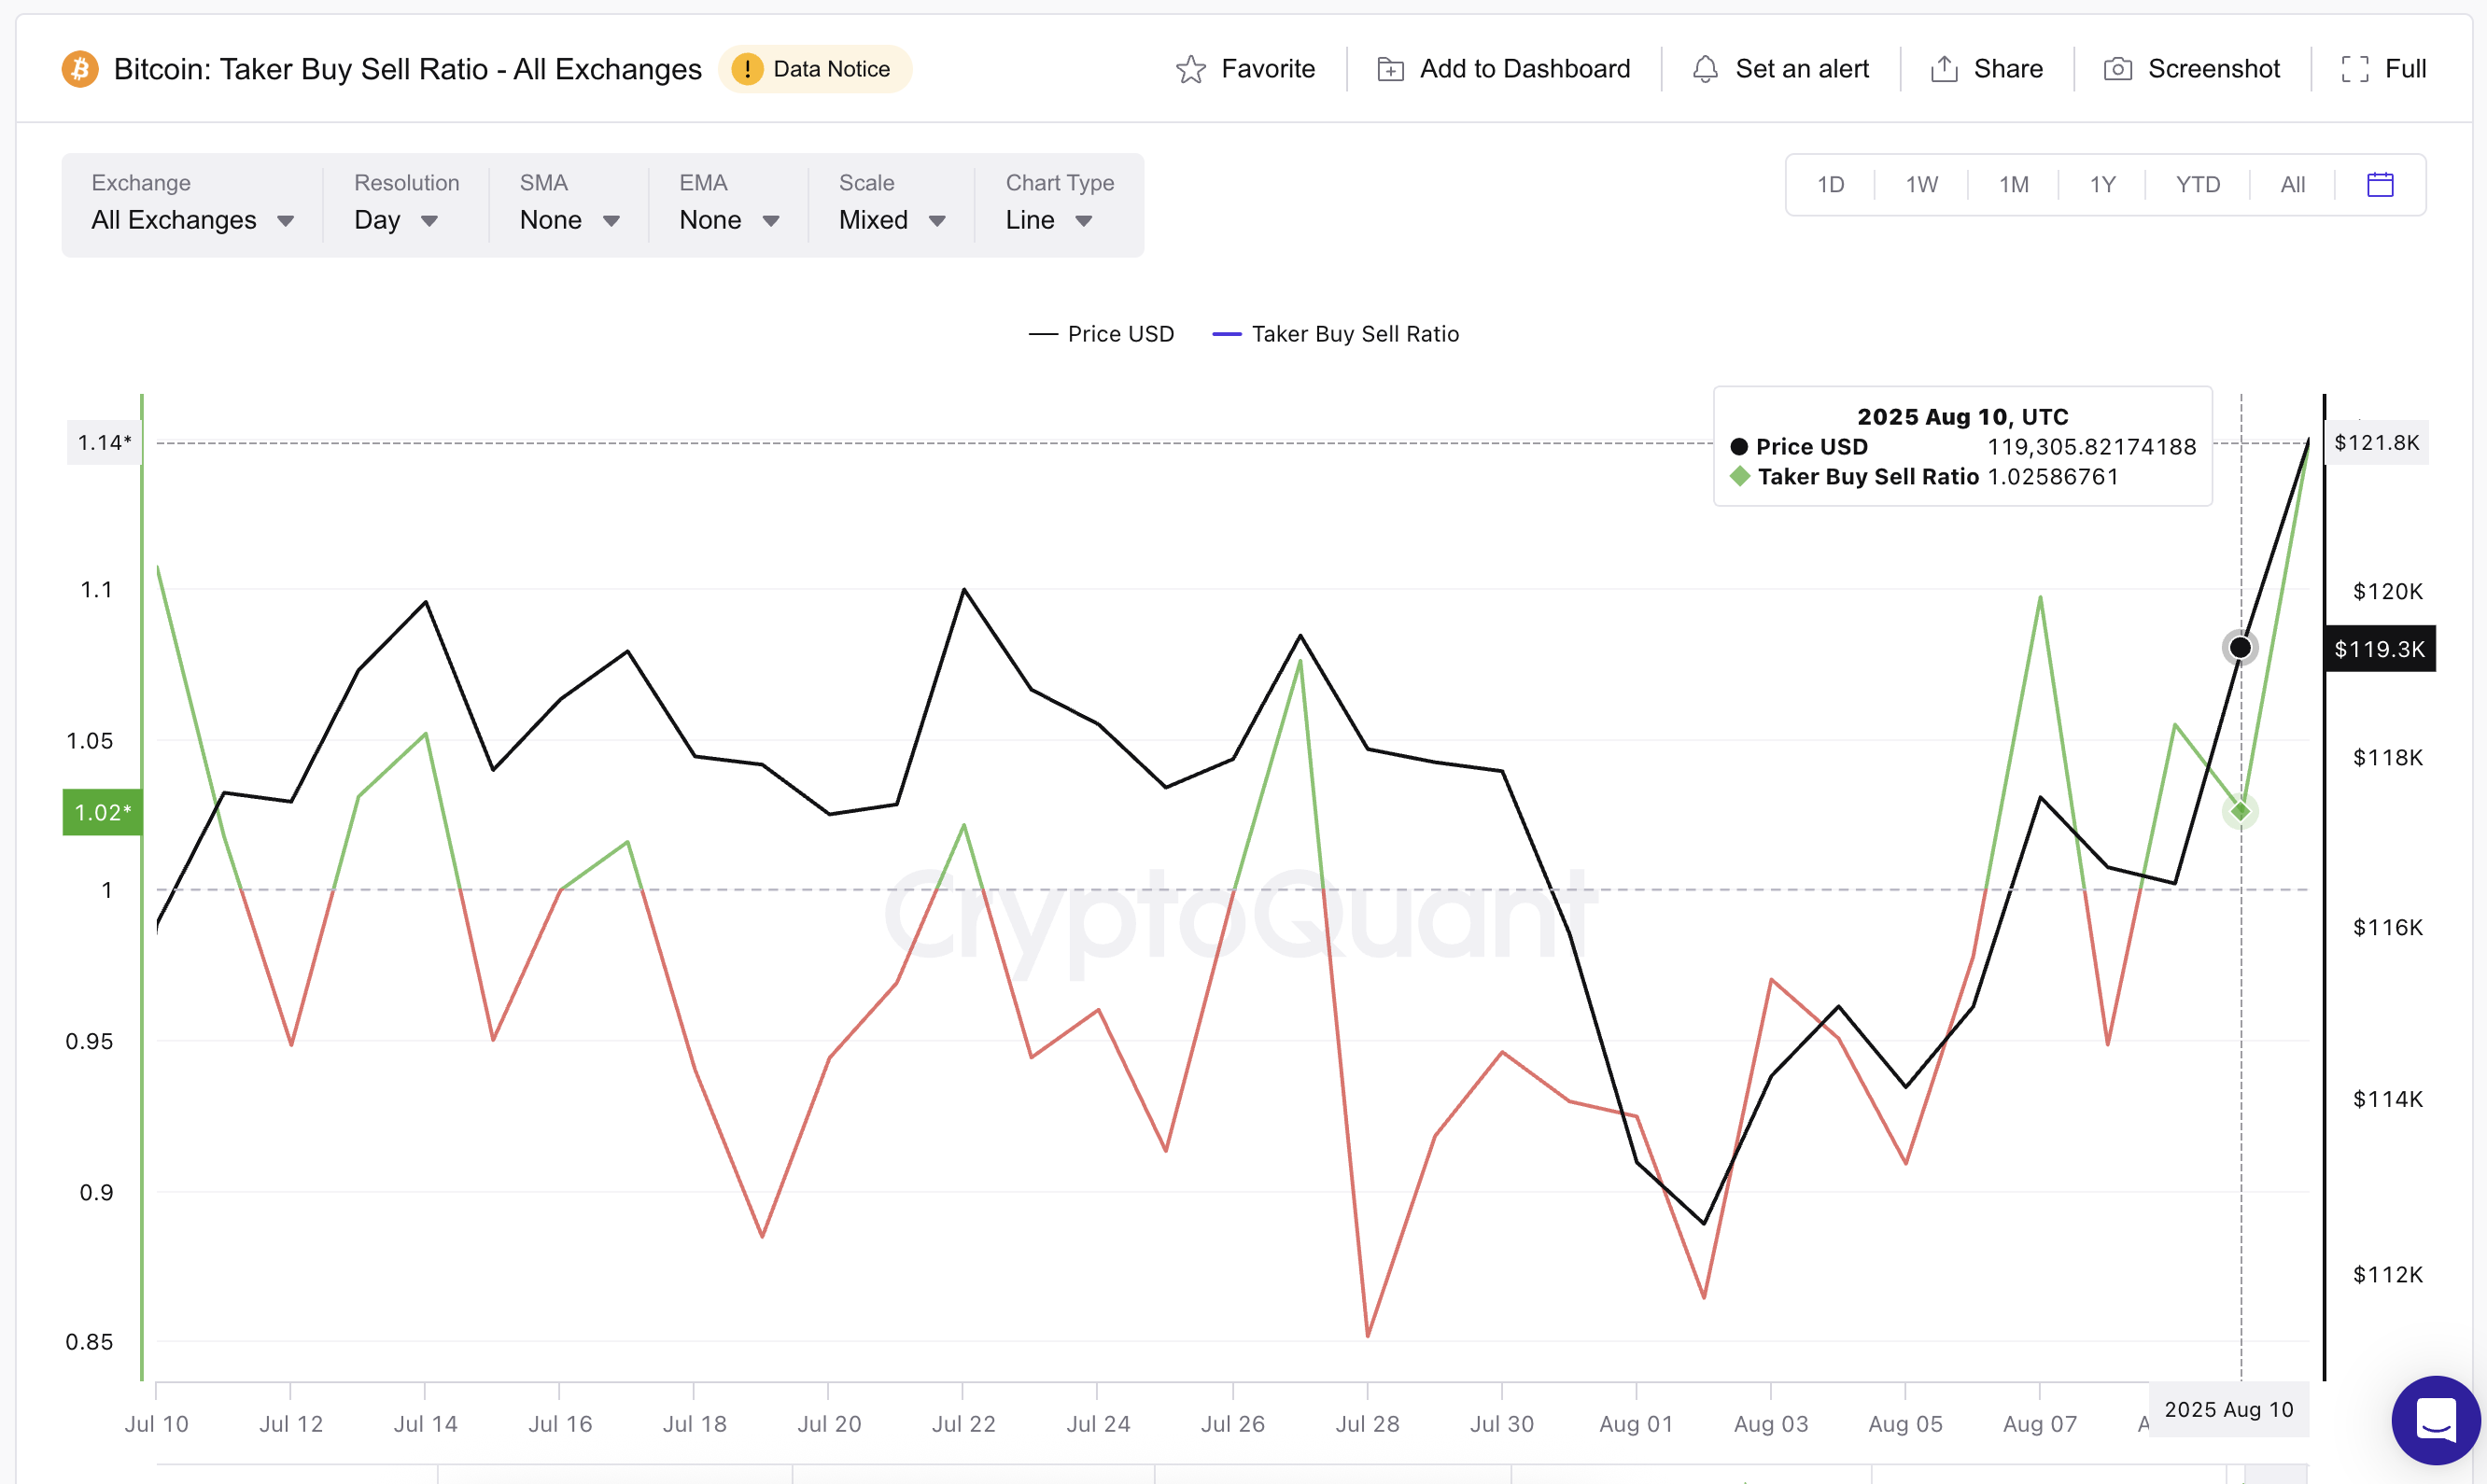
Taker Buy/Sell Ratio and RSI, Strong Demand
Spot market flows confirm the bullish trend. The Taker Buy/Sell Ratio measures whether aggressive market buying or selling is dominant. This ratio rose from a neutral 1.02 on August 10th to 1.14, the highest since early July.
This shows that buyers are overwhelming sellers with confidence.
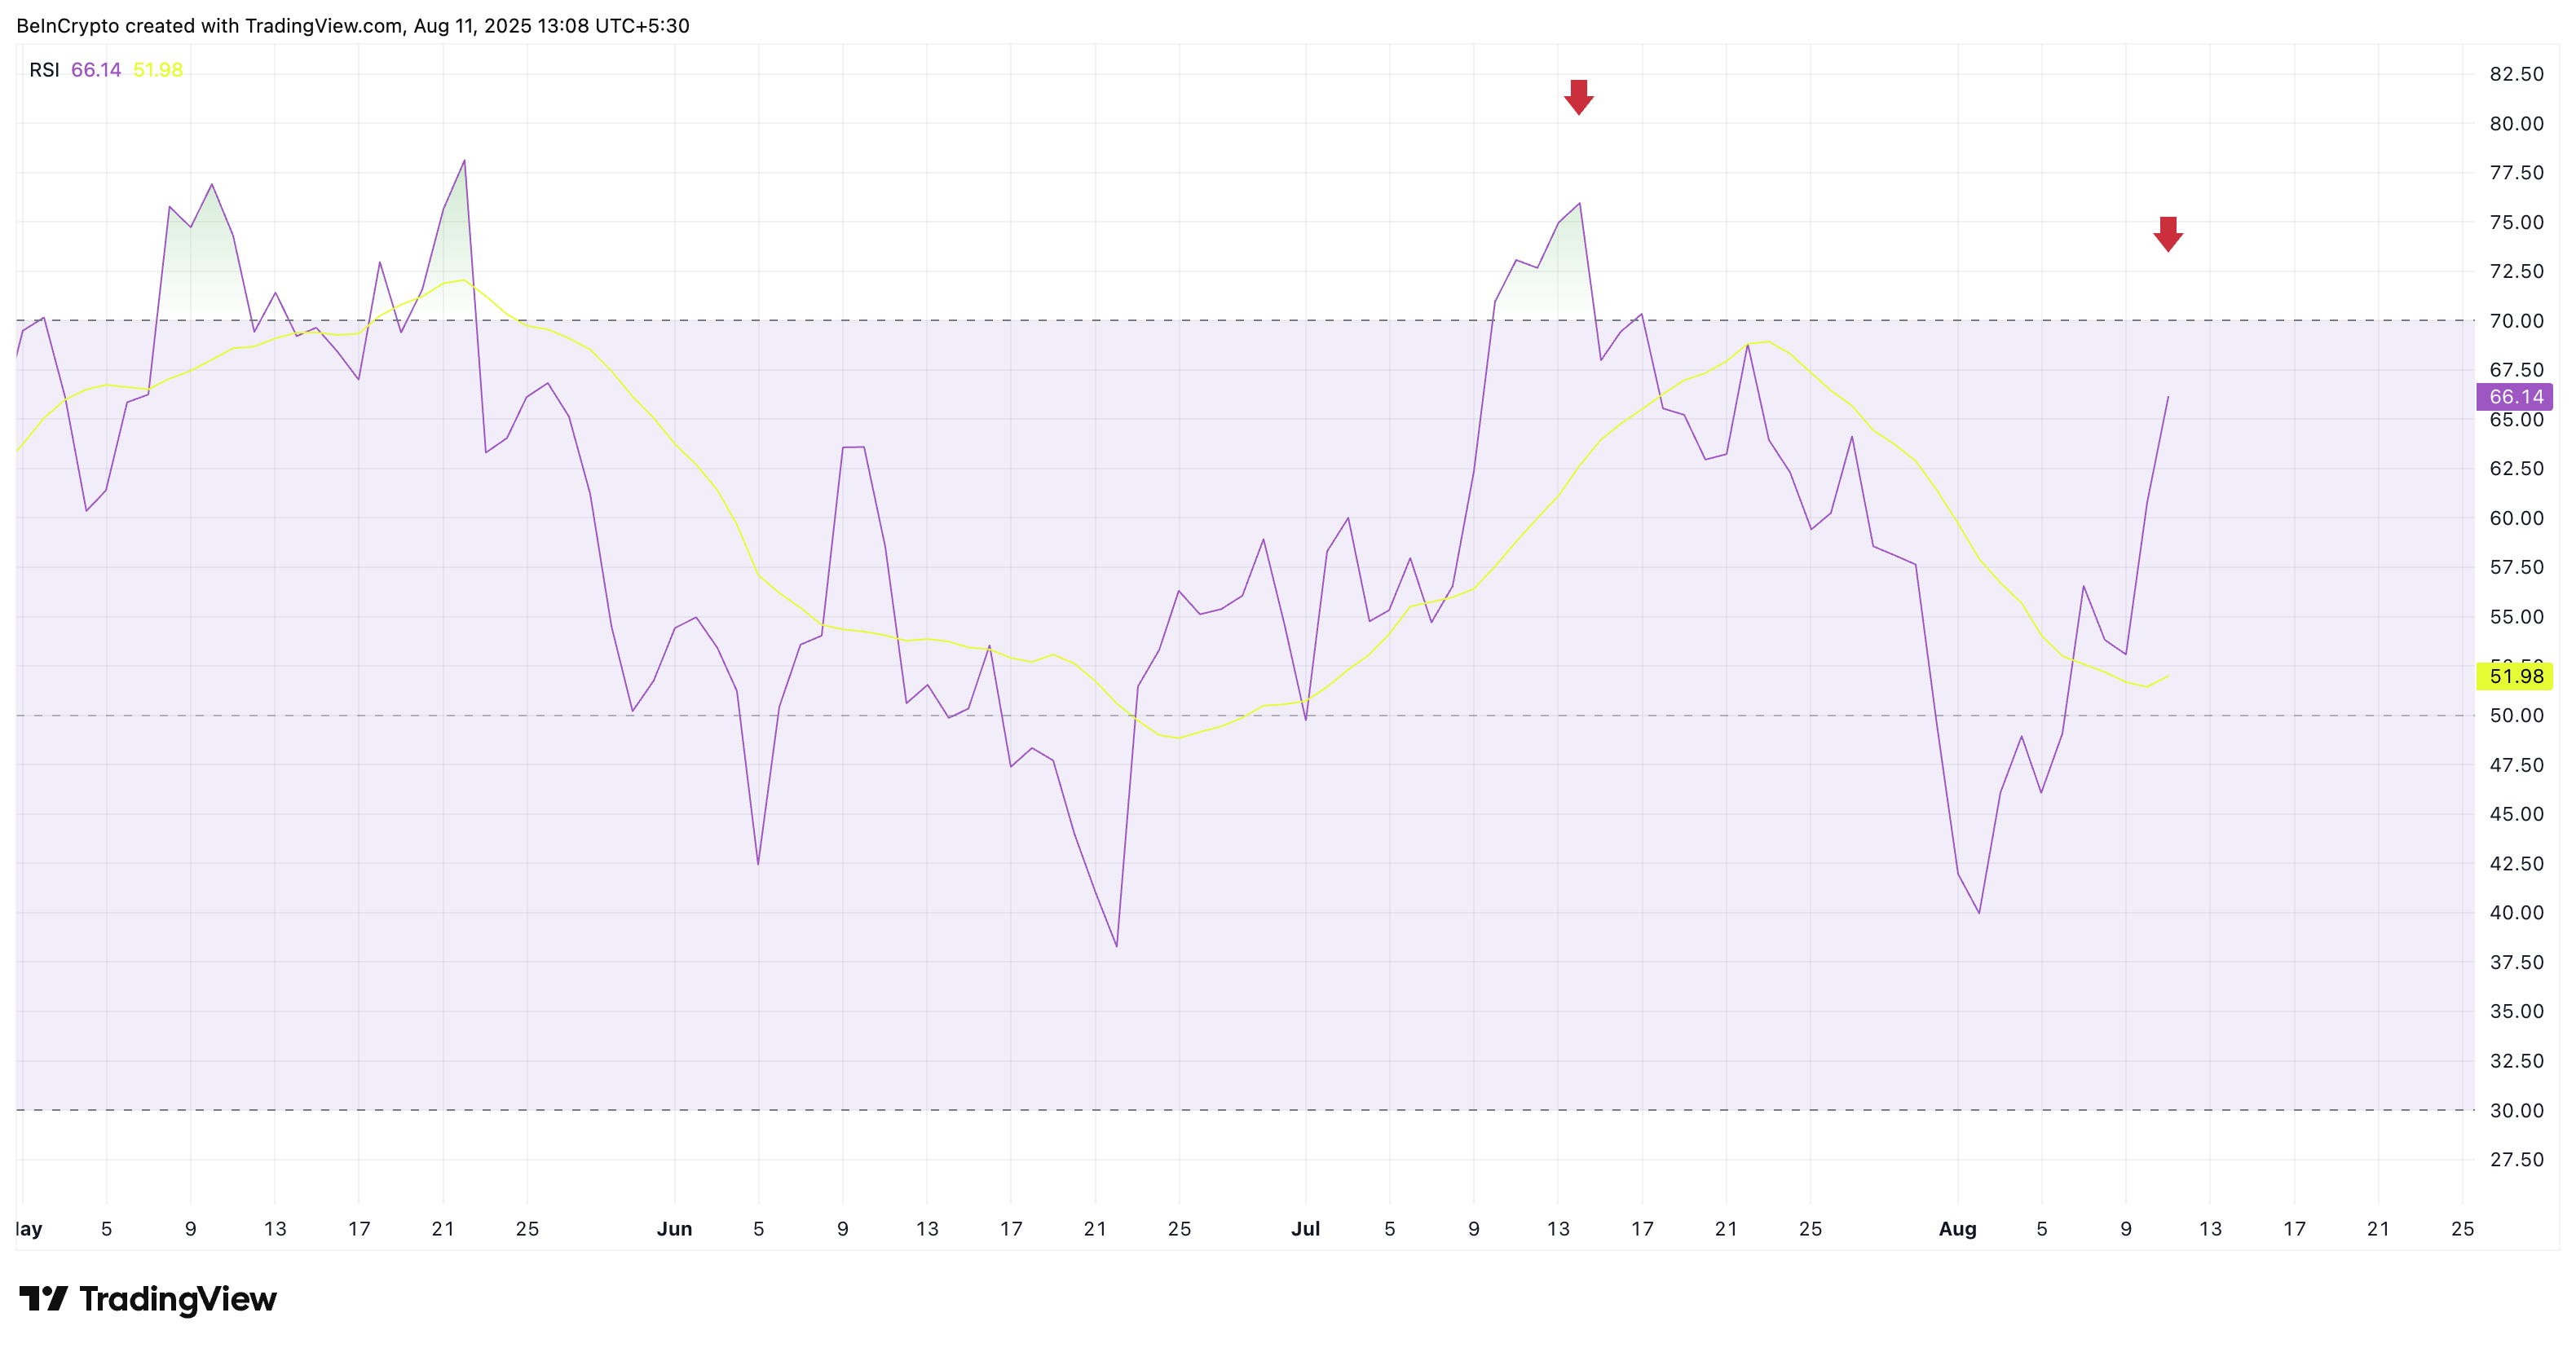
The Relative Strength Index (RSI) also supports this. On July 14th, the RSI was in the overbought zone above 75, which limited further increases. Currently, the RSI is near 66, and the price is 0.6% lower than the all-time high. This is far below the overbought threshold, providing more "room" for the Bitcoin price rally before technical exhaustion.
The RSI (Relative Strength Index) is a momentum indicator that measures the speed and magnitude of recent price movements on a 0-100 scale. Values above 70 can indicate overbought conditions, while values below 30 can indicate oversold conditions.
These indicators suggest that the rally could expand beyond the current resistance zone. The SOPR shows that this rally has not yet been constrained by heavy profit-taking. The recent surge in the Taker Buy/Sell Ratio and the RSI still being below the overbought zone suggest that buyers have the intention and technical space to push the rally further.
Bitcoin Price, Attention on Breaking All-Time High
On the daily chart, Bitcoin is still moving within a well-defined ascending channel. The price is applying pressure at the $123,230 Fibonacci 1.0 level, which is the same area that limited the July 14th rally. A clear breakout here could target $130,231.
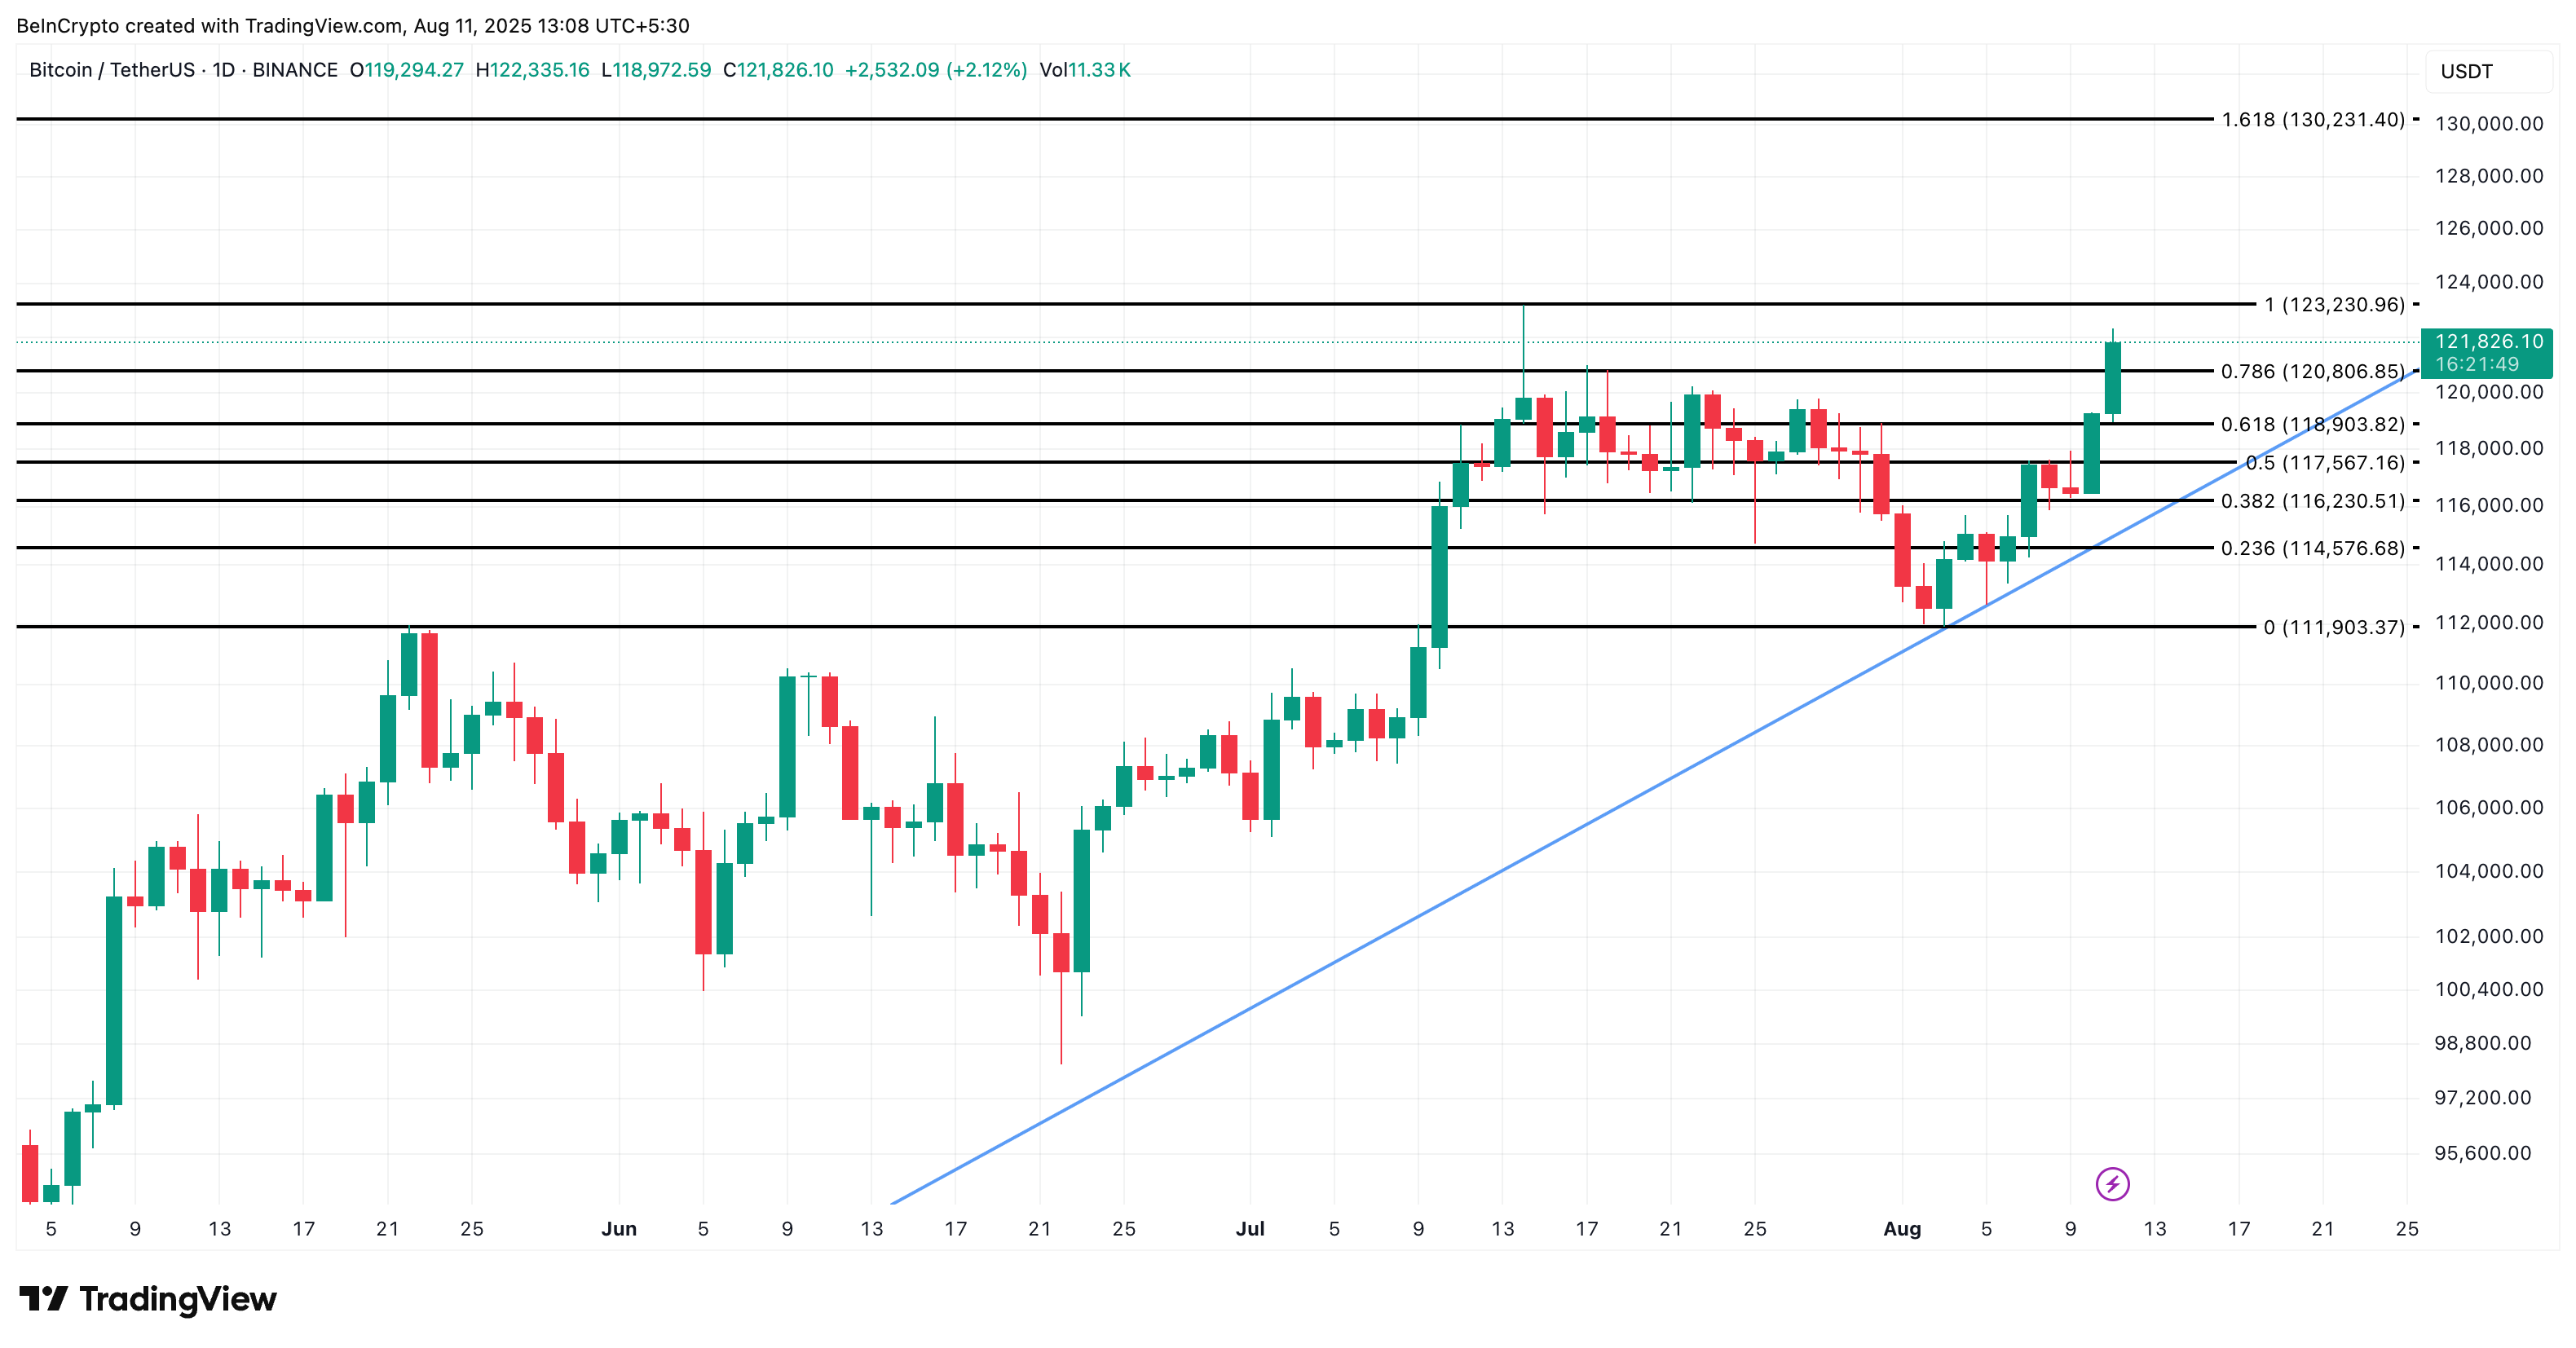
Key support levels to watch are $120,806 (Fibonacci 0.786) and $118,903 (Fibonacci 0.618). Staying above these levels will maintain the breakout hypothesis, while closing below could halt momentum.
If bullish indicators are maintained and a breakout occurs above $123,200 with volume, traders could see the market forming new highs faster than currently priced in. However, a drop below $118,900 would break the short-term bullish trend.