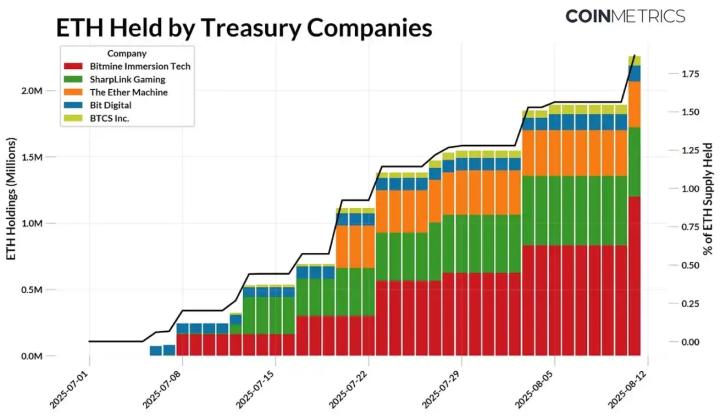
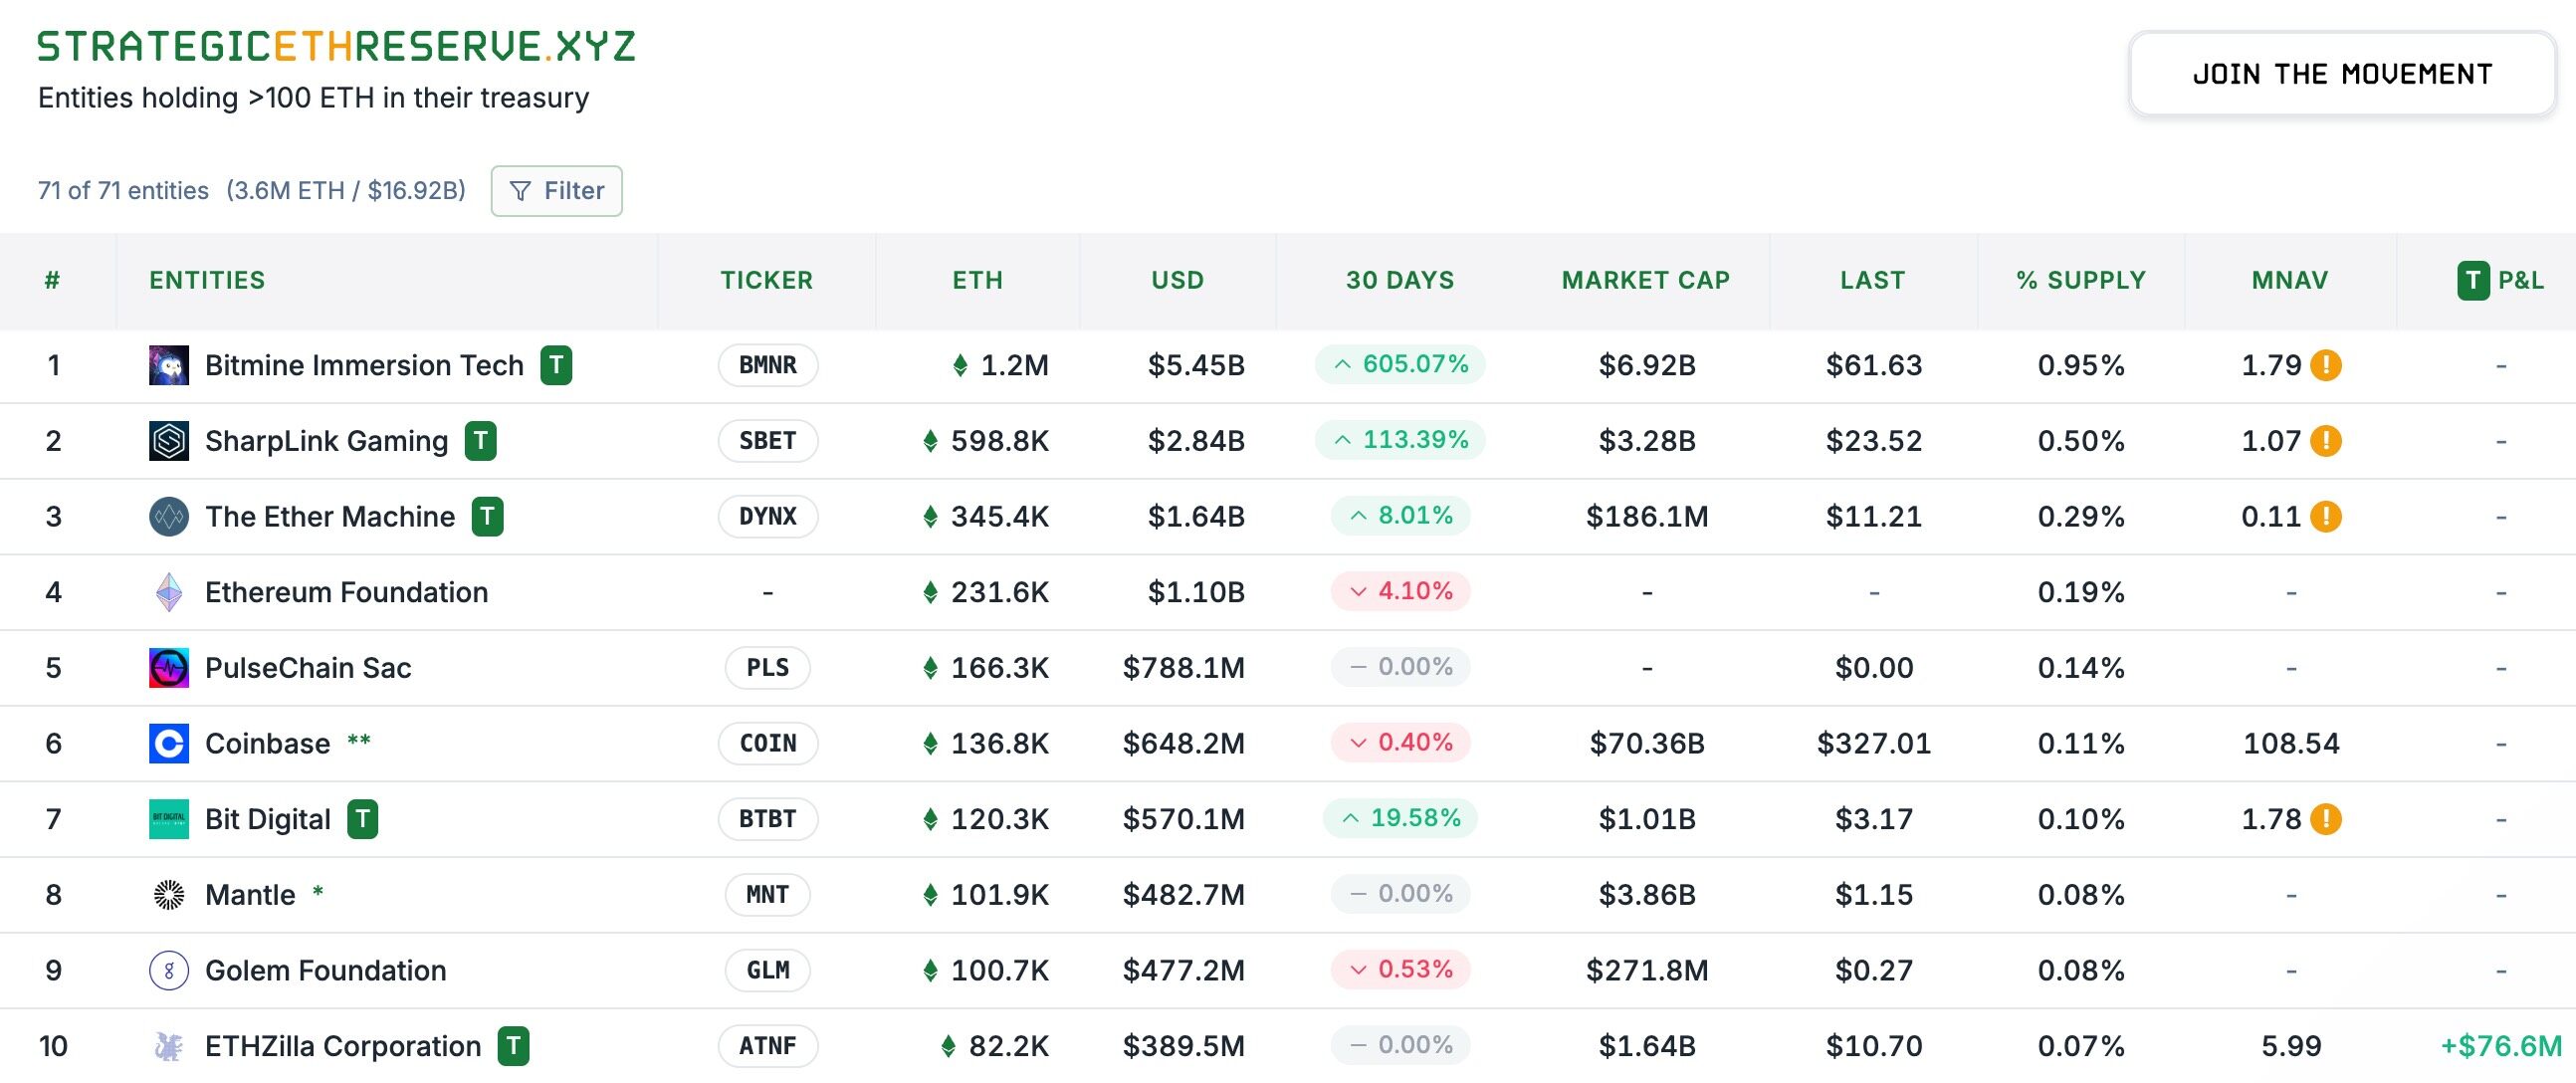
Editor's Note: The crazy buying spree of ETH Treasury companies has become the hottest topic in the recent market, and also constitutes the strongest "buying impact" on ETH price. Strategic ETH Reserve data shows that as of August 14 Beijing time, the total holdings of major ETF treasury companies have reached 3.57 million ETH, valued at approximately $16.92 billion. Among them, BitMine (BMNR), Sharplink Gaming (SBET), and The Ether Machine (DYNX) rank top three with 1.2 million, 598,000, and 345,000 ETH holdings respectively.
This morning, Michael Nadeau, founder of The DeFi Report who has long been tracking ETH conditions, reviewed the ETF chip distribution and changing trends outside of treasury companies (Note: Treasury company holdings may partially overlap with the following categories), which may help you determine the subsequent driving forces of ETH.
Below is Michael Nadeau's original text, compiled by Odaily.
People always discuss ETH's price trend, but the real key lies in its distribution pattern. Once you see the actual distribution of ETH - existing in different domains such as ETF, staking contracts, Layer 2, wrapped tokens, exchanges, etc., you can insight into:
- Who truly holds the control;
- Capital flow and actual liquidity scale;
- Where the next "buying impact" might come from;
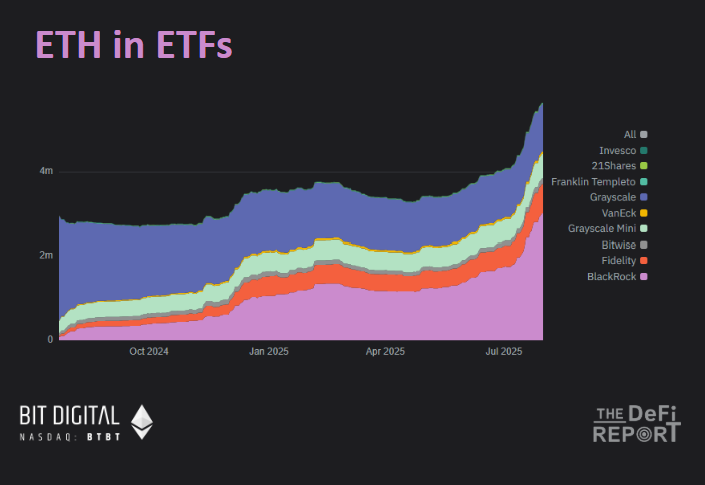
ETF Holdings
Various Ethereum ETFs currently control about 5% of ETH supply.
Over the past 3 months, ETH ETF's assets under management have grown by 80%, with BlackRock and Fidelity's ETFs occupying 73% of the asset management scale.
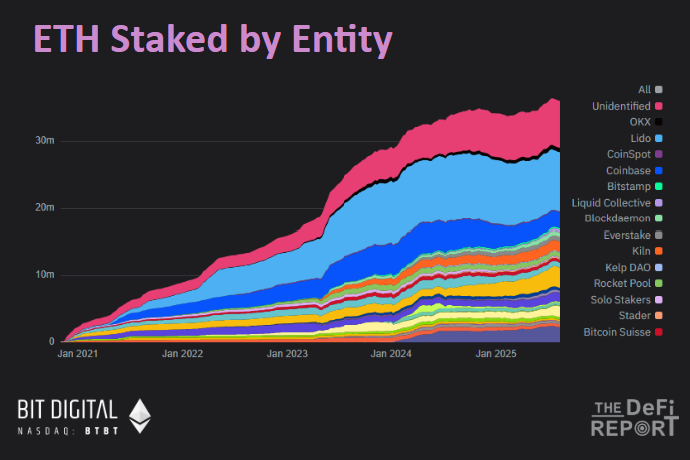
Staking
Currently, about 29.7% of ETH is in staking status.
Over the past three months, ETH's staking scale has grown by 5%. During the same period, Lido's market share dropped by 3.5%, while Binance's staking share rose by 23%, currently ranking second.
As more ETH treasury companies invest ETH into staking, we expect this number to continue rising in the coming months.
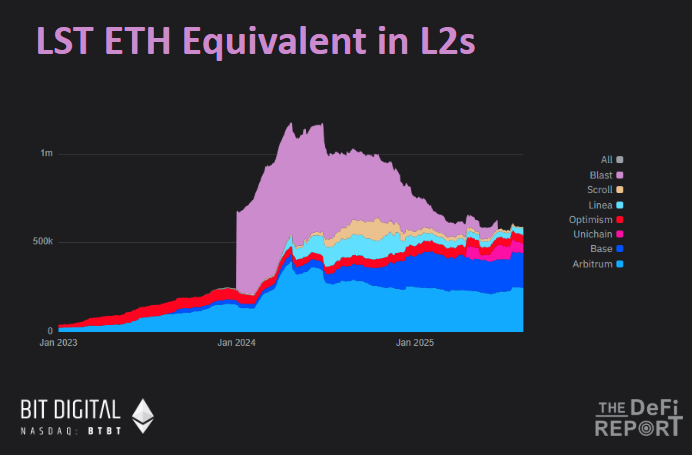
Layer 2 (Including LST)
ETH in Layer 2 currently accounts for only 5% of circulating supply.
Over a year ago, Blast occupied 52% of Layer 2 ETH supply, now almost 0% - the incentive program is simply a waste of money. Currently, 41% of ETH is on Arbitrum, and 33% is on Base.
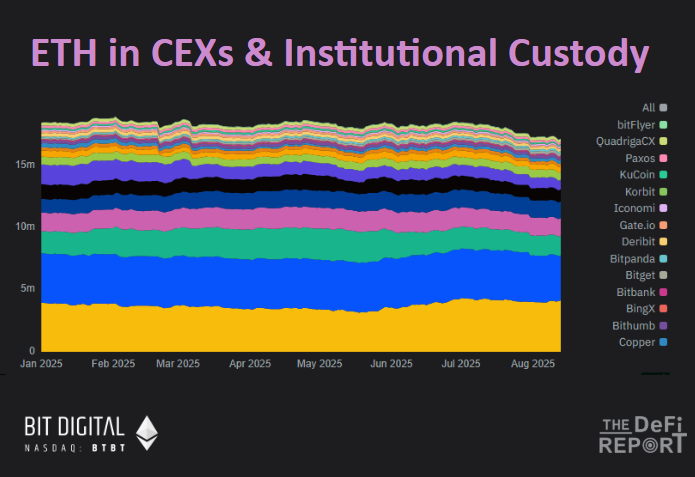
Centralized Exchanges (CEX)
Currently, the total ETH on major CEXs accounts for 14% of circulating supply.
This number has dropped by 6.7% since the third quarter, currently at its lowest level since July 2016.
Where did these ETH go? Most have entered staking contracts and cold wallets.
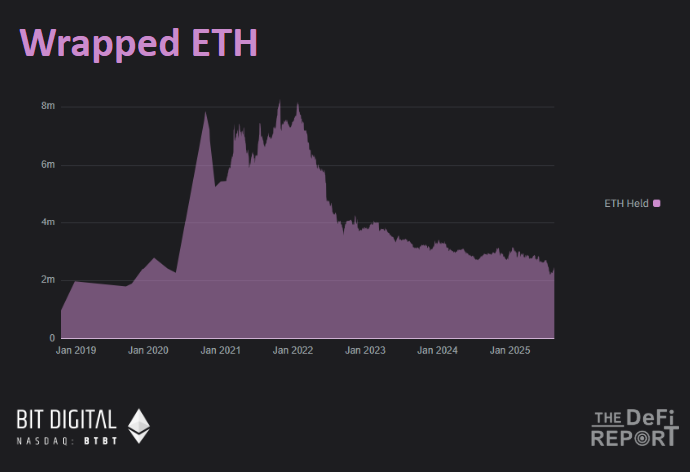
Wrapped ETH
Wrapped ETH currently accounts for only 1.8% of circulating supply.
Since early 2022, this number has dropped from its peak of 70%, a decline trend that coincides with the rising trend of ETH in staking contracts.
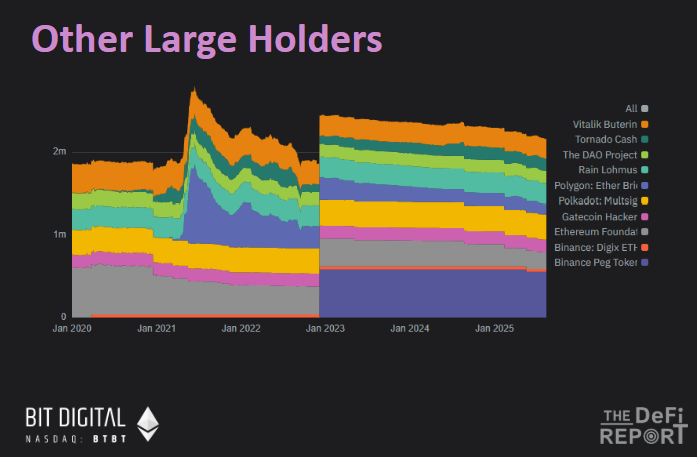
Other Major Holding Entities and Individuals
Excluding the above categories, other major holding entities and individuals' ETH holdings total about 1.7%.
Within this 1.7%, Binance's Binance Peg Tokens Fund accounts for about 25%, with Polygon Bridge, Tornado Cash, Ethereum Foundation, and Vitalik himself being the main holders.
In summary, the above six charts cover about 55% of ETH supply. Beyond this, most of the remaining ETH is stored in external owned accounts (EOA) and cold wallet storage.