#DOGE
- DOGE is trading below its 20-day moving average but shows technical signs of potential reversal
- MACD bullish divergence and Bollinger Band positioning indicate possible upward momentum
- Growing institutional interest and positive news sentiment provide fundamental support
DOGE Price Prediction
Technical Analysis: DOGE Shows Consolidation Pattern
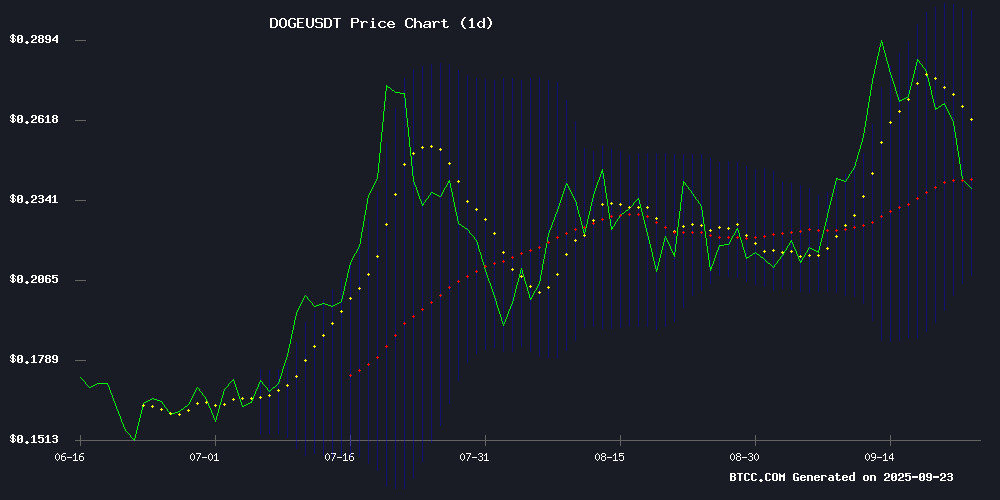
According to BTCC financial analyst Mia, Doge is currently trading at $0.24112, below its 20-day moving average of $0.253842. The MACD indicator shows a slight bullish divergence with the histogram at 0.000941, suggesting potential momentum shift. The Bollinger Bands indicate DOGE is trading closer to the lower band at $0.208276, which could act as support. The current positioning suggests consolidation with a potential upward bias if key resistance levels are breached.
Market Sentiment: Positive Catalysts Emerging
BTCC financial analyst Mia notes that recent news headlines indicate growing institutional interest and technical breakout potential for Dogecoin. The combination of key support holding and Fibonacci level signals suggests building positive momentum. However, Mia emphasizes that these bullish signals should be viewed in context with the technical indicators, which currently show a more cautious short-term outlook.
Factors Influencing DOGE's Price
Dogecoin Holds Key Support as Technicals Signal Potential Breakout
Dogecoin maintains its footing above the critical $0.23 support level, with secondary defense at $0.20. The TD Sequential indicator flashes a buy signal, historically preceding bullish reversals—analyst Ali Martinez notes this pattern often marks turning points.
A decisive breach of the $0.31 resistance could propel DOGE toward $0.38, though current trading shows a 3.37% dip to $0.2403. Market capitalization stands at $36.2 billion amid $9.39 billion daily volume, reflecting sustained interest despite short-term softness.
Accumulation patterns and technical resilience suggest growing optimism. The memecoin's ability to hold key levels while flashing bullish indicators positions it for a potential rally, mirroring past recoveries from similar setups.
DOGE Price Analysis: Is a Rally Imminent Amid Growing Institutional Interest?
Dogecoin (DOGE) faces a critical juncture after weekend bearish pressure pushed its price toward the $0.22-$0.23 support zone. The meme coin's resilience comes amid two significant developments: the launch of the first U.S.-listed DOGE ETF (DOJE) and sustained social media buzz.
The DOJE ETF debut generated $17 million in trading volume, signaling institutional appetite for DOGE exposure through regulated channels. Technical charts show DOGE trading within a rising parallel channel, with Ichimoku Cloud and MACD indicators suggesting potential momentum shifts.
Market participants are watching whether DOGE can maintain its foothold above key support levels. The combination of technical patterns and fundamental developments creates a compelling narrative for the cryptocurrency originally created as a joke.
Dogecoin Fibonacci Level Signals Potential Price Rally
Dogecoin (DOGE) has retraced from its recent peak at $0.3 amid intensified selling pressure, despite the Federal Reserve's 0.25% rate cut failing to spur momentum. Analysts now eye a potential rebound, citing technical and fundamental drivers.
Technical analyst MadWhale notes DOGE is approaching a critical Fibonacci support level near $0.24. Historical patterns suggest such levels often catalyze reversals in crypto markets. A hold above this threshold could trigger an 18% rally toward $0.315, as traders historically accumulate at these junctures.
The meme coin's price action mirrors prior retracement-rebound cycles, where Fibonacci levels served as springboards for renewed bullish momentum. Market participants await confirmation of this support holding to gauge the next directional move.
Is DOGE a good investment?
Based on current technical and fundamental analysis, DOGE presents a mixed investment case according to BTCC financial analyst Mia. The cryptocurrency is trading below its 20-day moving average but shows potential for upward movement based on MACD divergence and Bollinger Band positioning.
| Indicator | Current Value | Signal |
|---|---|---|
| Current Price | $0.24112 | Below MA |
| 20-day MA | $0.253842 | Resistance |
| MACD Histogram | 0.000941 | Bullish Divergence |
| Bollinger Position | Near Lower Band | Oversold Potential |
While technical indicators suggest potential for recovery, investors should consider the volatile nature of meme coins and monitor key support levels closely.