Stellar (XLM) price showed signs of rebound at the beginning of this month, but dropped by more than 4% in the past 24 hours. After recording a solid 53% increase in July, XLM began to look unstable, and one major technical signal warned of another potential decline.
By examining the short-term timeframe, investor positioning, and price levels, we can early identify if the downward trend this week is likely to continue.
2-Hour Chart Weakness Signal... Confirming Net Inflow
It is worth looking at the short-term timeframe to understand whether this weakness is a simple temporary drop or the start of a larger correction. On the 2-hour chart, the 20-period moving average (EMA) or red line crossed below the 50-period EMA (orange line). This is often called a "death cross" setup, indicating an increase in short-term sellers' momentum.
Token Technical Analysis and Market Update: Would you like more of these token insights? Subscribe to editor Harshi Notariya's daily crypto newsletter here.
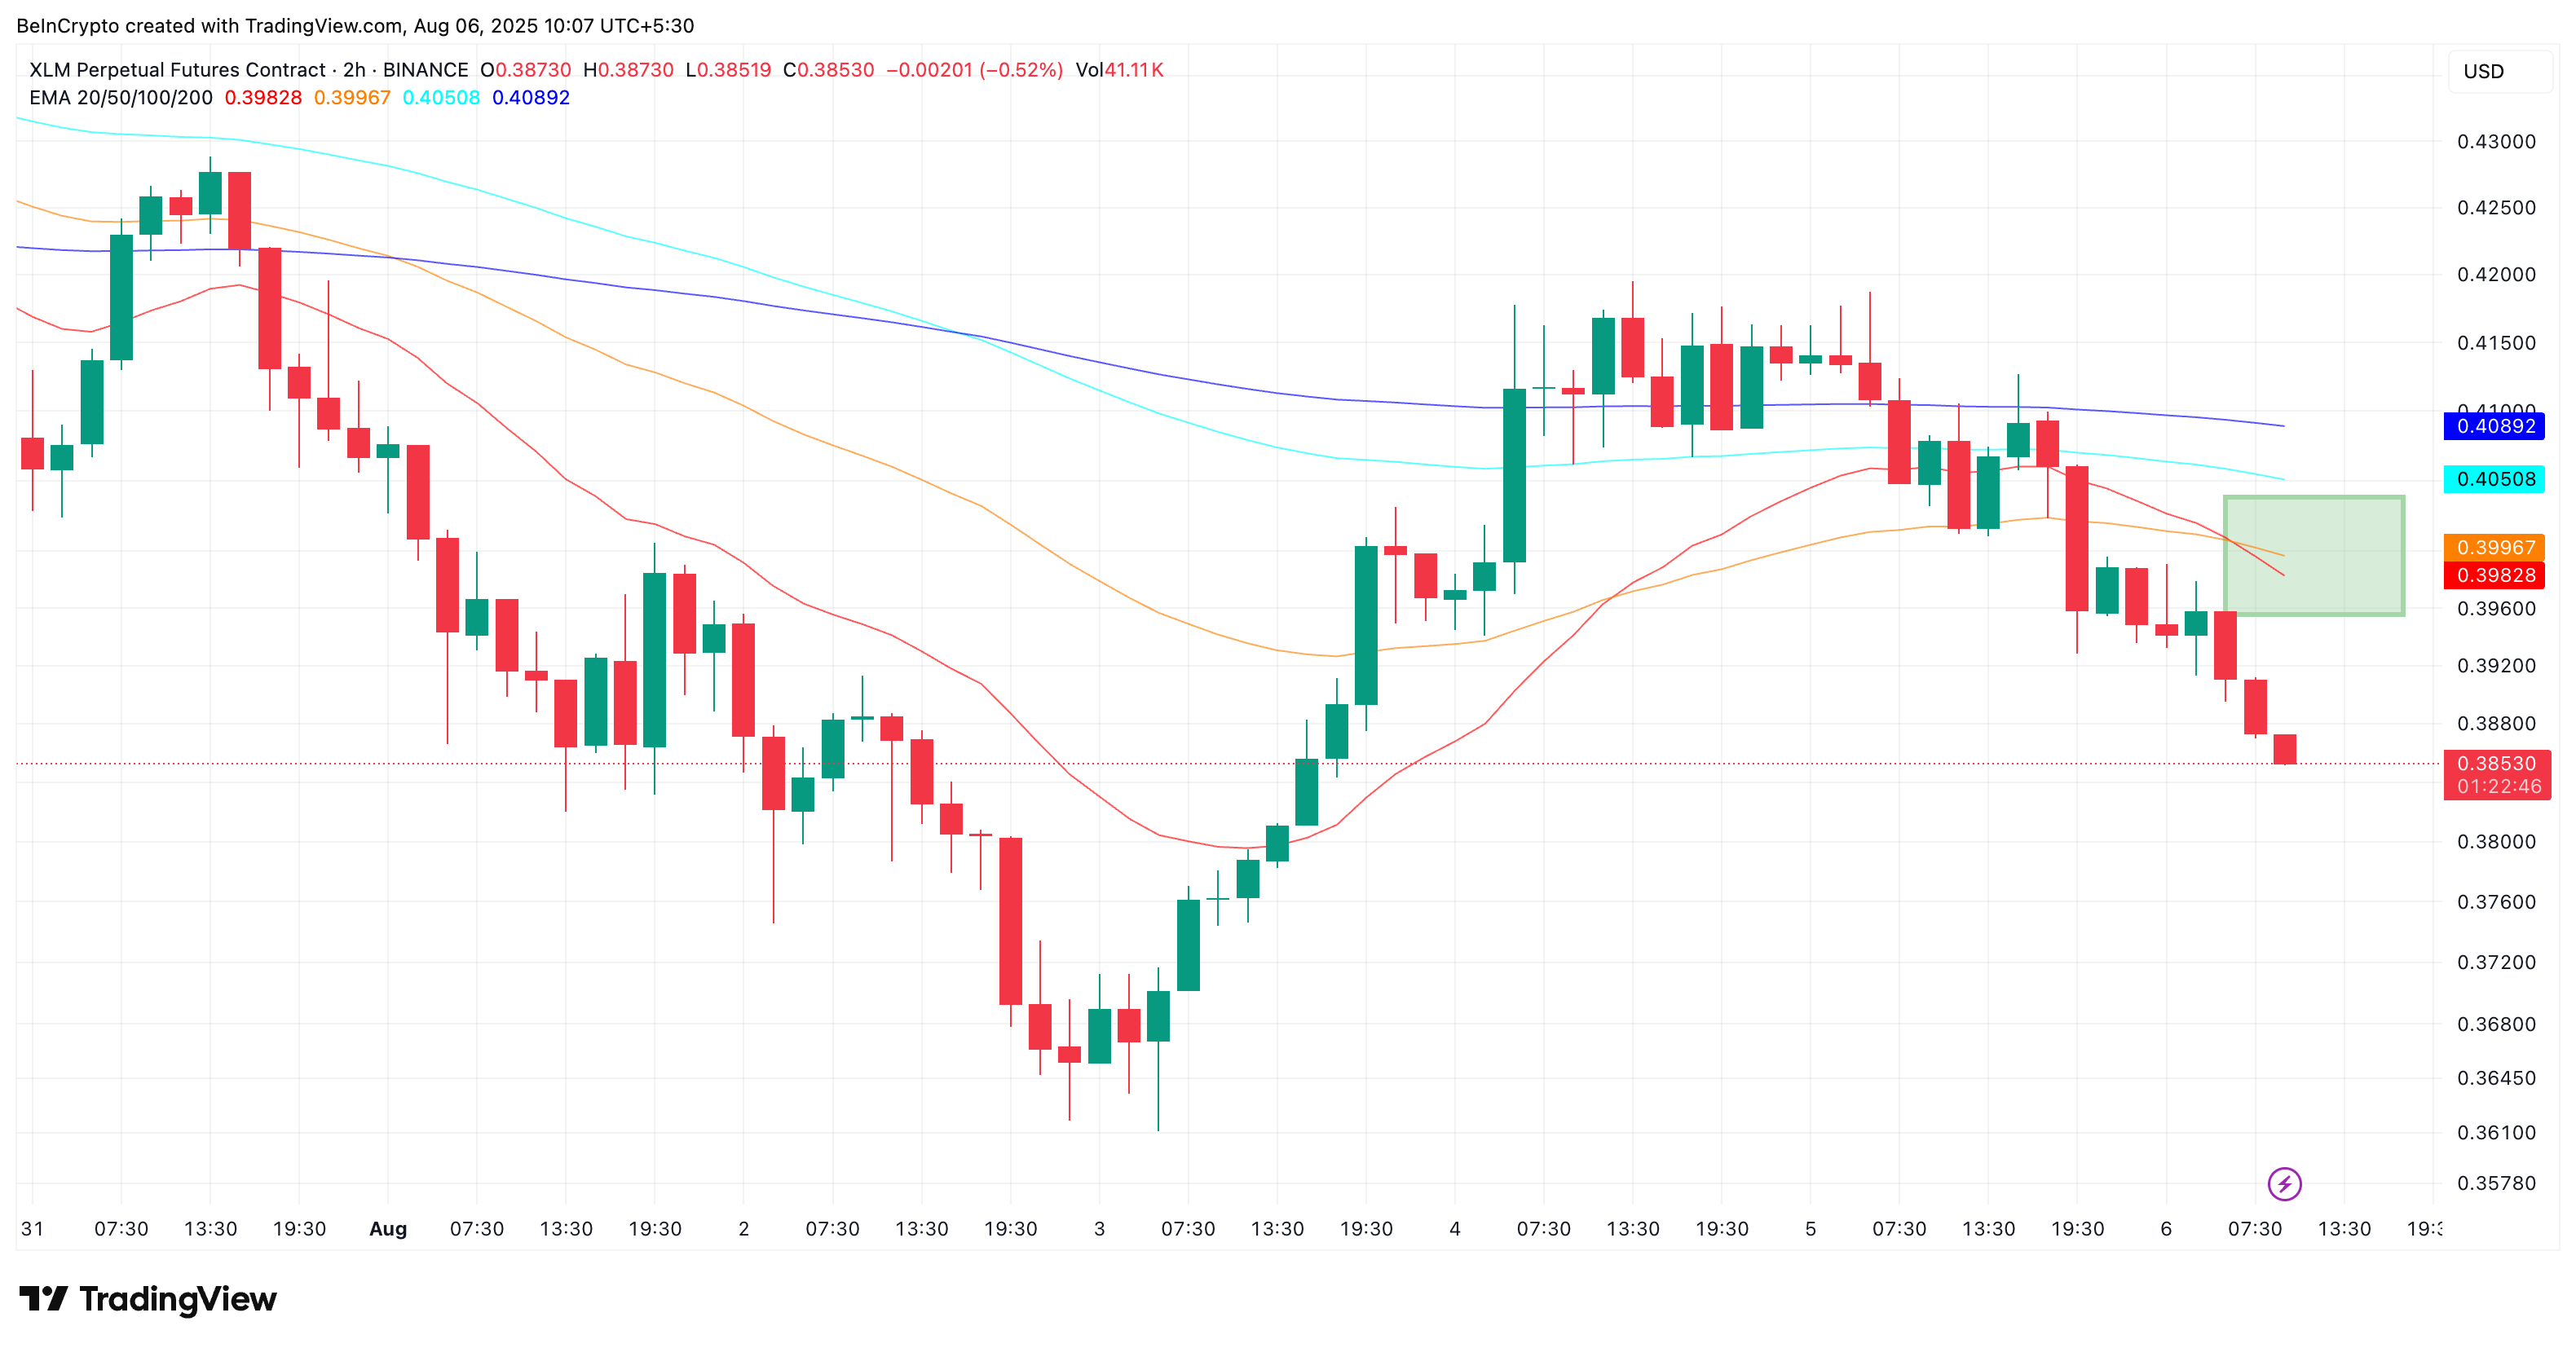
EMA crossover occurs when one moving average crosses another on the chart. When a short-term EMA (e.g., 20-period) crosses below a long-term EMA (e.g., 50-period), it can indicate increasing short-term selling.
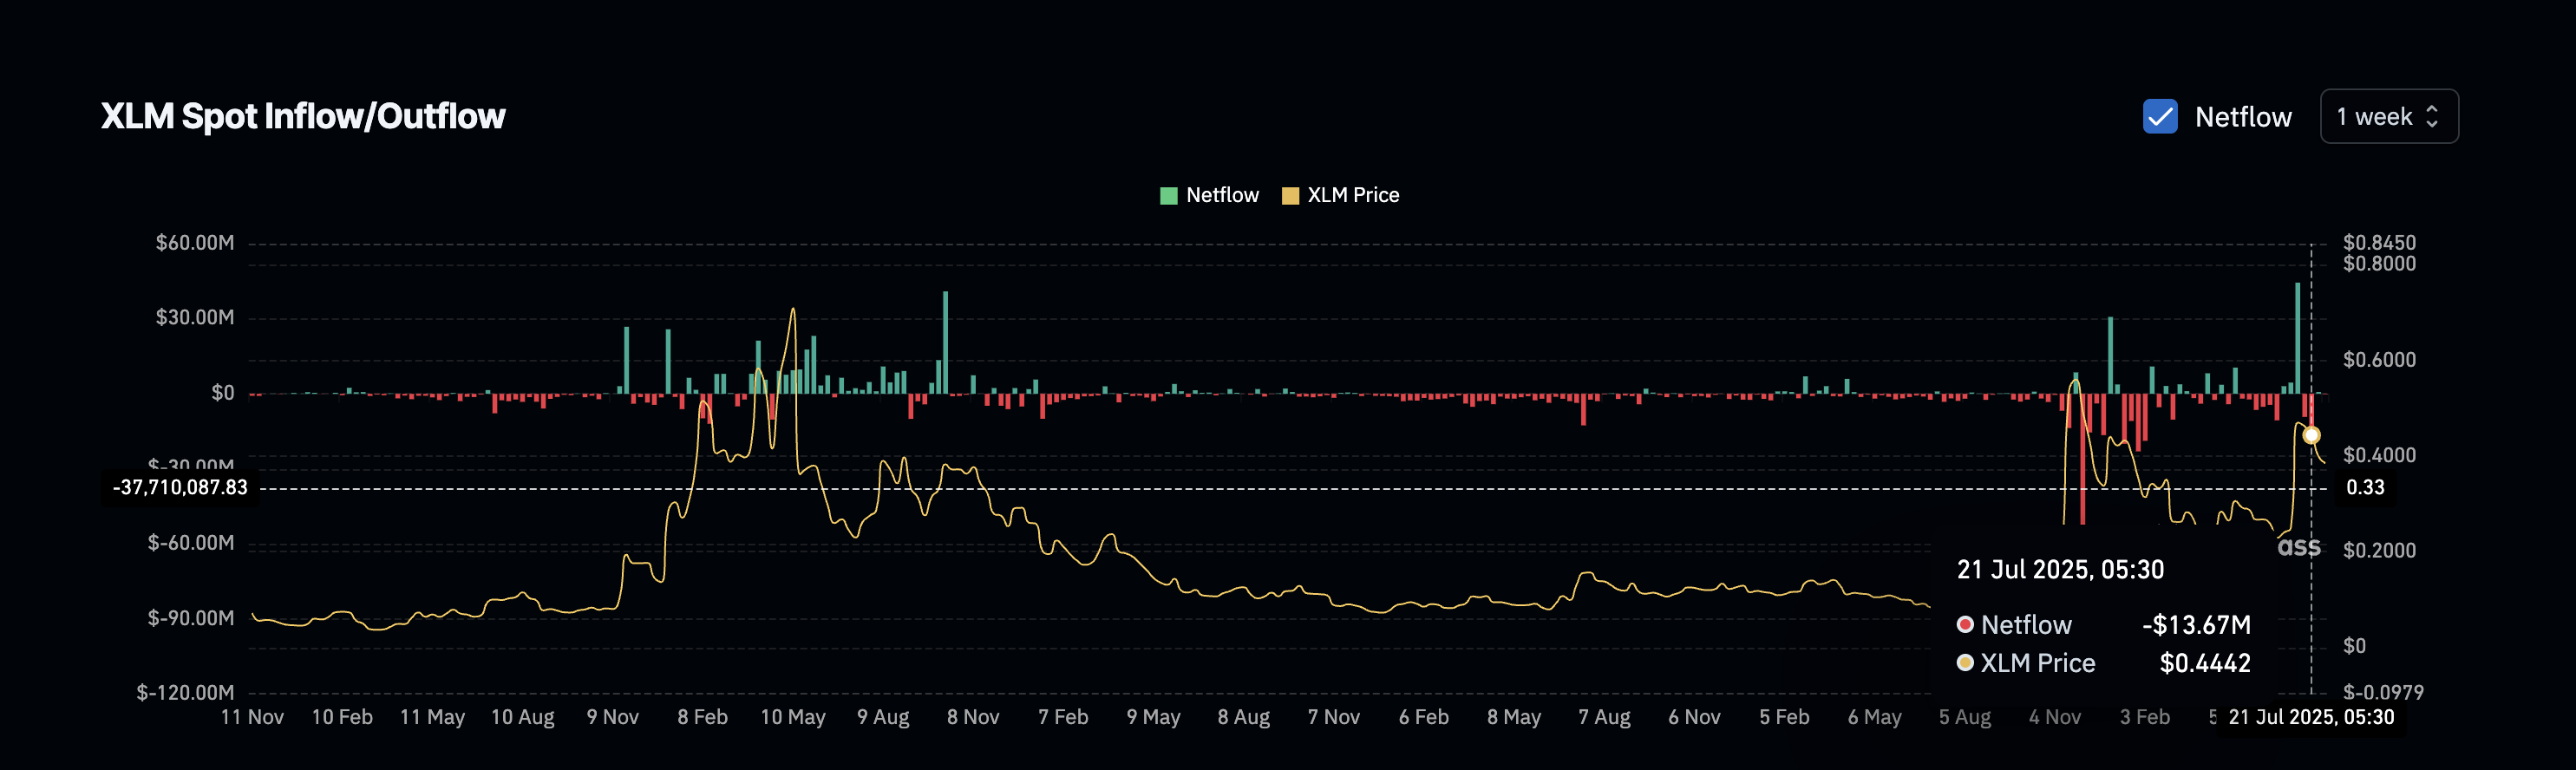
This is supported by changes in net exchange flow. Net outflow was slightly negative over the past two weeks, meaning more tokens are leaving exchanges. However, the flow turned positive this week (though just a small green dot). This is a warning signal indicating holders are preparing to sell.
Downward Momentum Forming... Market Bias Supporting
Beyond chart signals, market sentiment shows bearish momentum is returning. The Bull-Bear Power (BBP) index, which compares recent highs and lows with spot purchasing power, has sharply turned bearish over the past two sessions. This suggests buyers are struggling to catch up, and sellers are pushing Stellar price down.
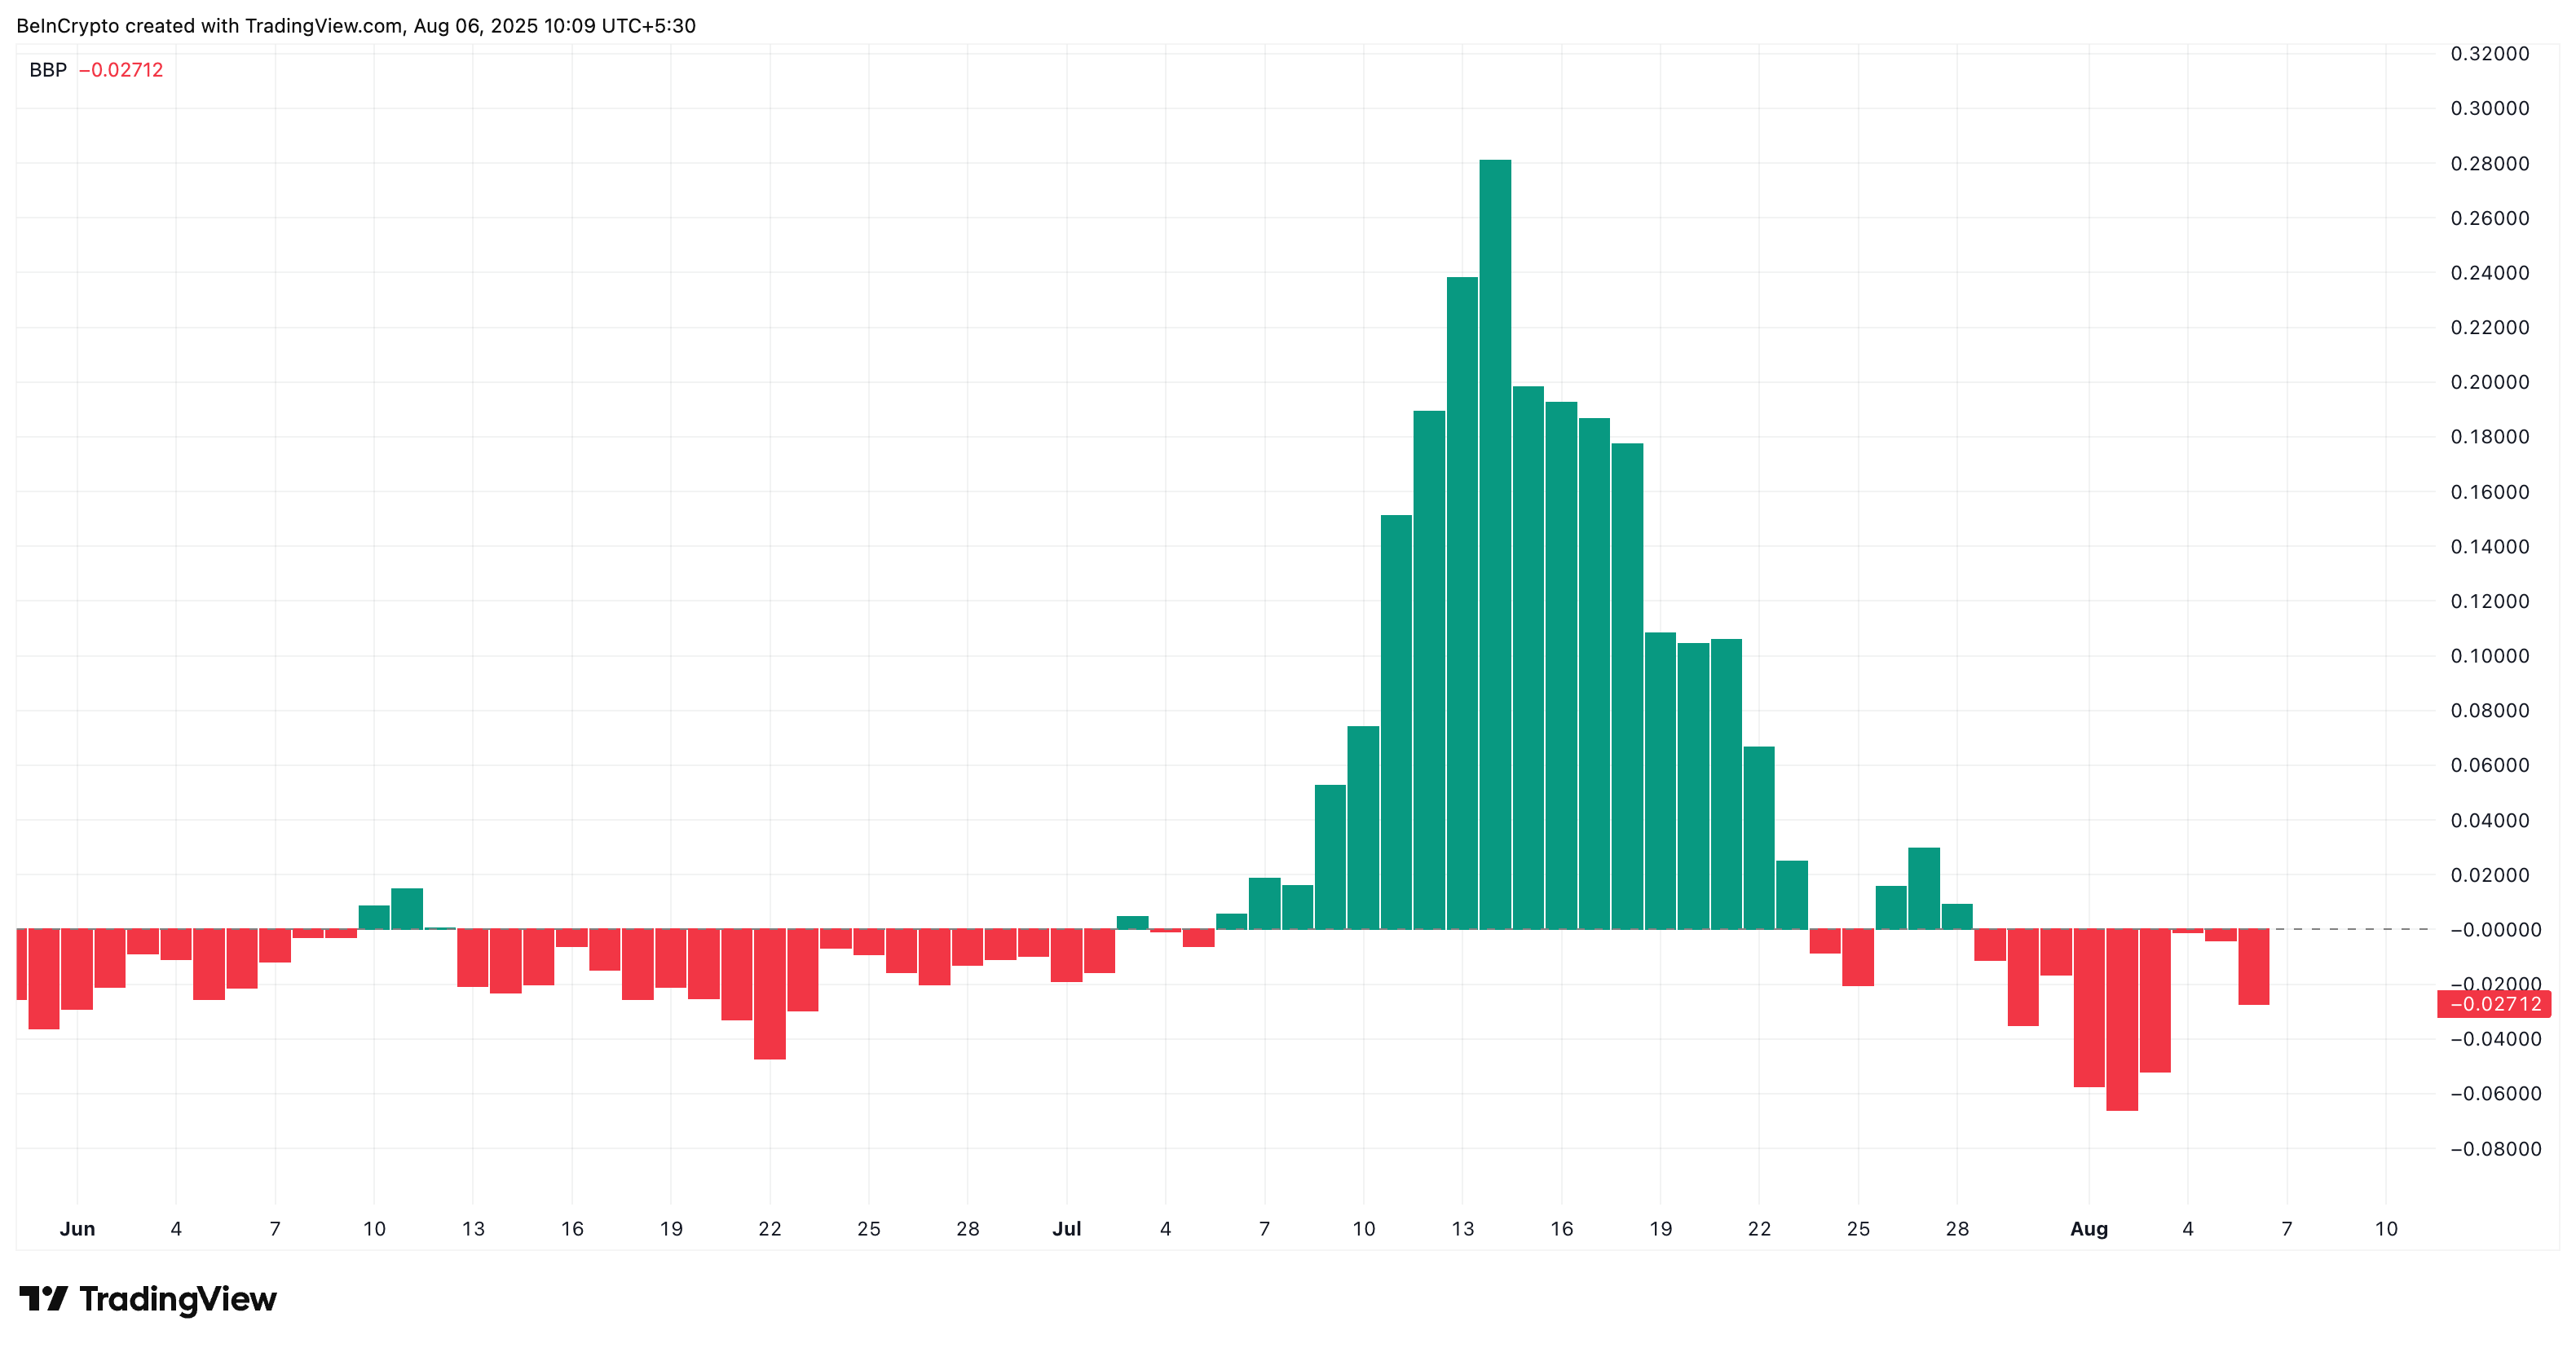
BBP measures the strength of buyers (bulls) and sellers (bears) in recent price movements. A negative index indicates bears are in control.
The change is also clear in the Long/Short account ratio. According to Coinglass, currently 60.67% of traders hold a Short position on XLM. This indicates most expect the Stellar (XLM) price to fall further. An excessive Short market can sometimes lead to a Short squeeze, but in this case, it aligns with negative Stellar price movements and trend indicators.
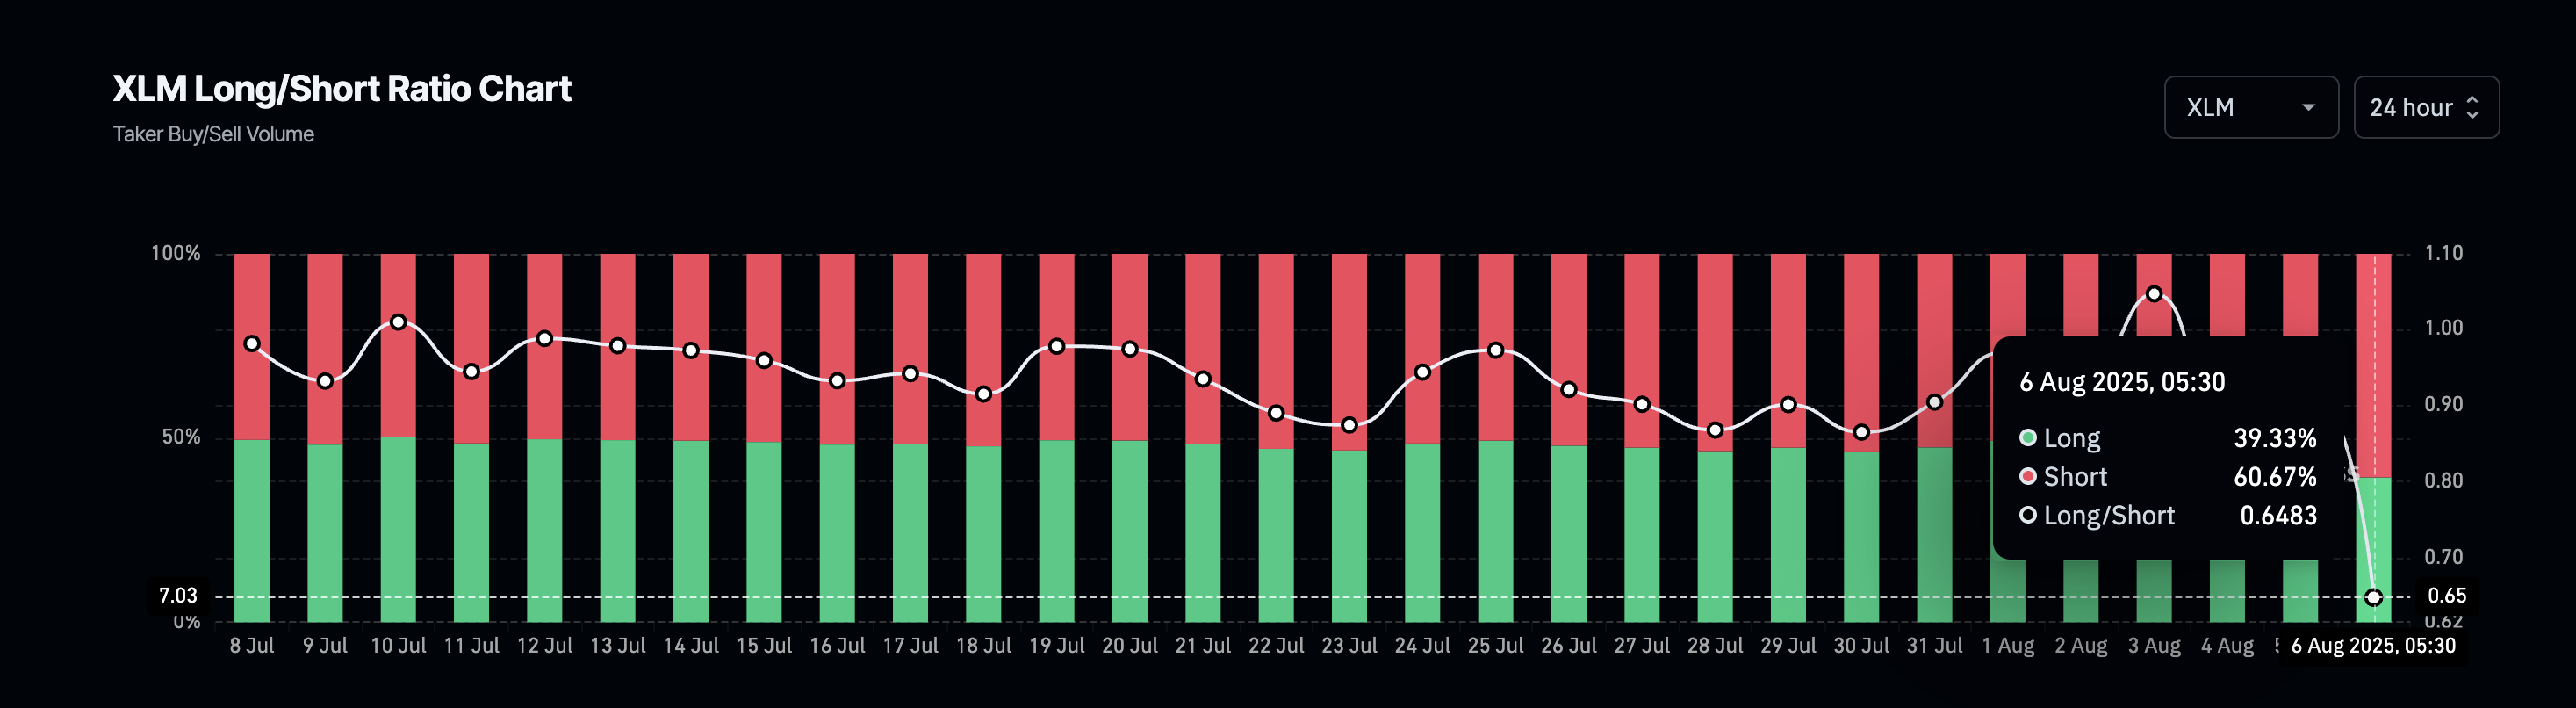
The Long-Short ratio shows the number of traders betting on price increase (Long) and decrease (Short). A high Short ratio means most anticipate XLM price decline.
Stellar (XLM) Price Collapse Risk... Support Level to Watch
XLM price is currently trading near $0.38, just above a short-term support level at $0.37. If it falls below $0.37 and breaks $0.33, deeper selling is likely. If $0.33 level is not maintained, Stellar price could revisit $0.28. Falling below that would confirm a complete momentum collapse.
There is hope for recovery if bulls defend $0.37 and push XLM price above $0.40 and $0.45. Crossing $0.40 would invalidate the short-term bearish hypothesis.
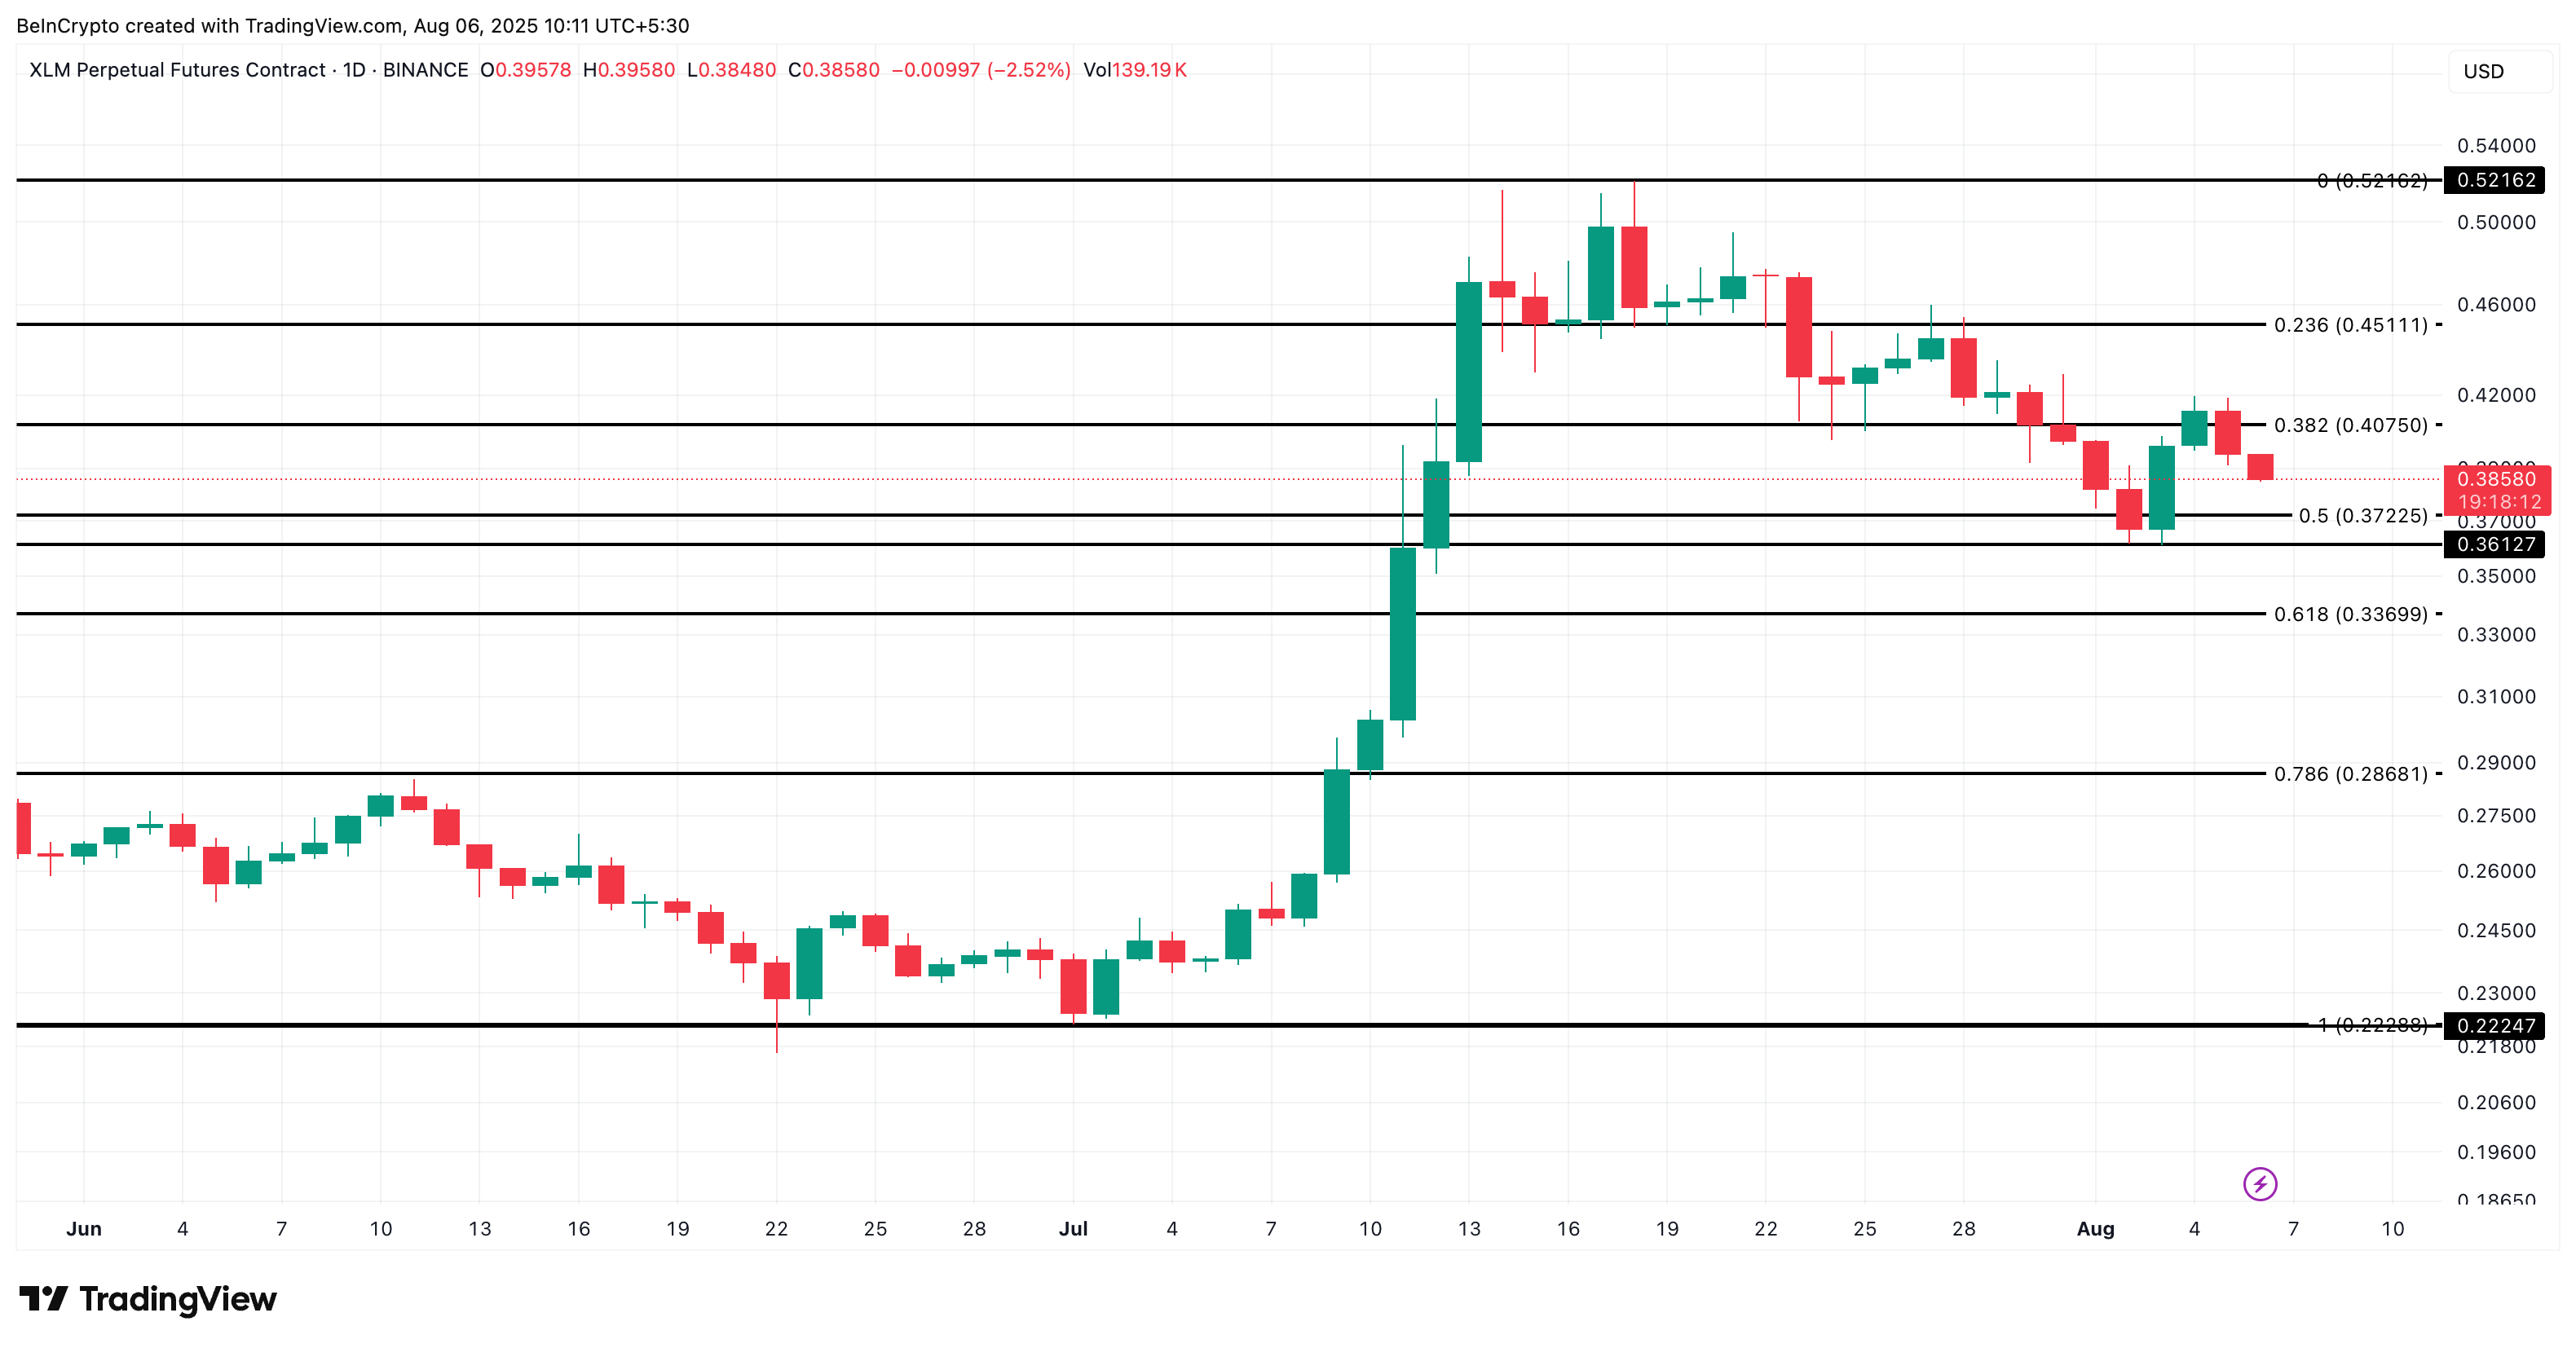
The true test comes at $0.52. Clearly breaking this resistance would fully confirm a new upward trend. Until then, Stellar (XLM)'s structure remains unstable.