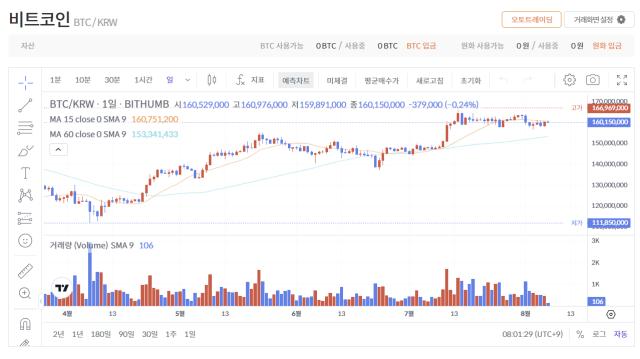
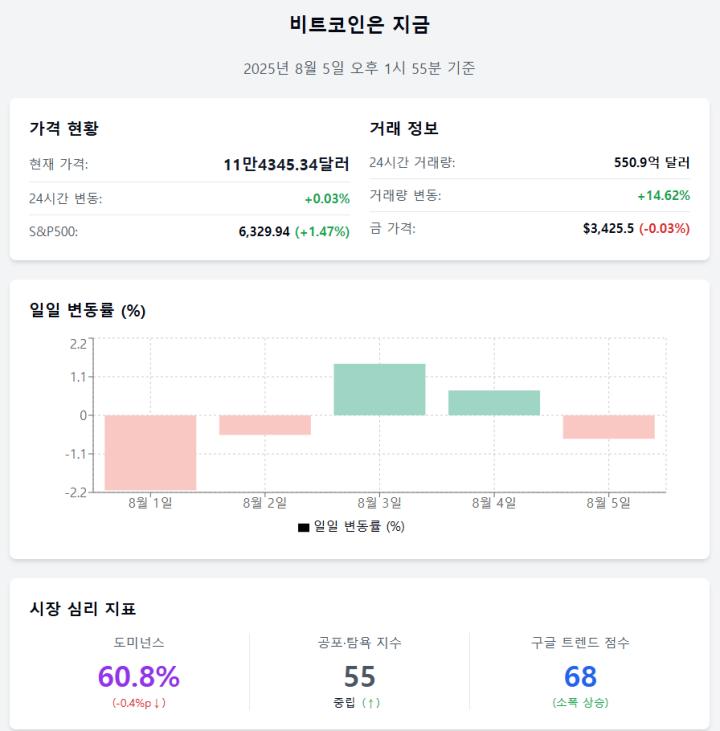
Bitcoin price remained relatively stable this week. After recently reaching an all-time high of $122,000, the price has mostly remained stagnant. It declined by 3.1% over the past 7 days, but increased by 5.8% last month.
ETF outflows have now exceeded $1 billion, marking the longest consecutive record since April. Many traders had anticipated a deeper correction. However, while the price has not crossed a key level, several signals suggest Bitcoin might be preparing for a larger movement if that level is breached.
Short-term sellers still at a loss... pace slowing down
Over the past month, whenever the Bitcoin price reached local highs of $115,000 or above, short-term holders who purchased BTC in recent weeks began selling. The used output age bands clearly demonstrate this. On July 22, July 28, and August 6, Bitcoin attempted higher prices, but selling started at the peaks from wallets holding BTC for less than a month.
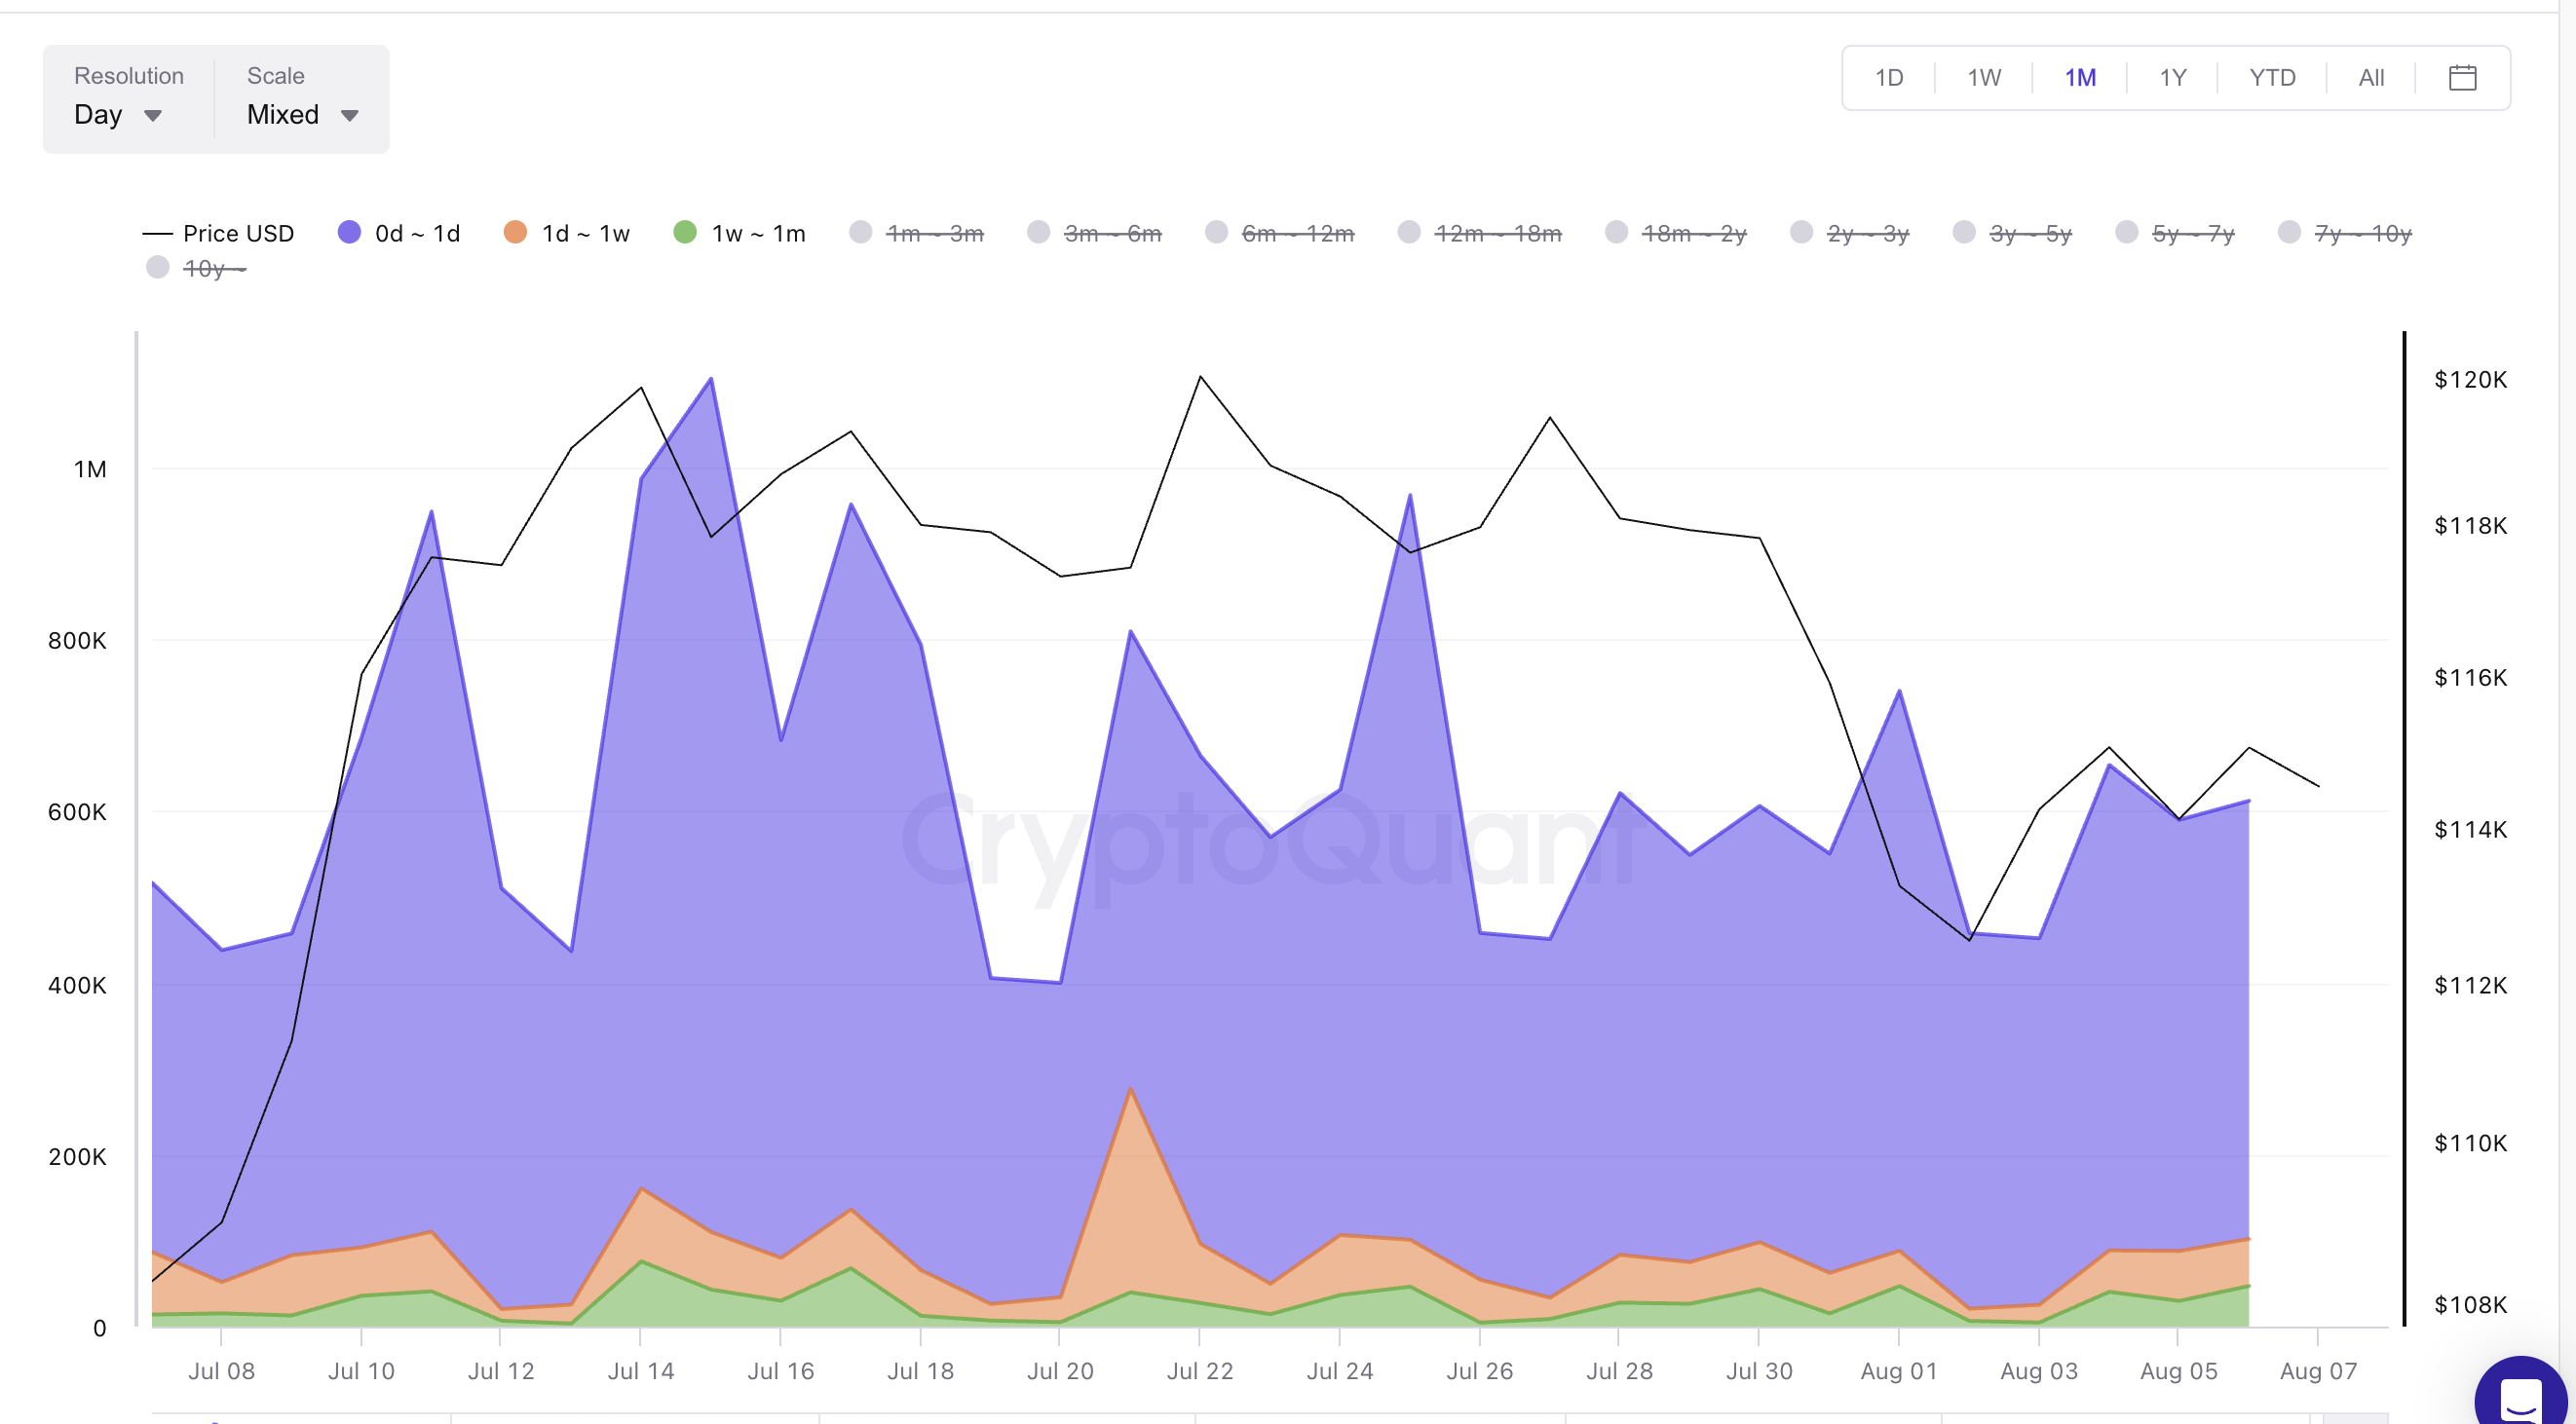
This shows short-term traders are realizing quick profits, forming local peaks in the spent output indicator. However, something changed after July 25. These selling surges are weakening. This could mean short-term traders are running out of BTC to sell or gaining more confidence in holding. If this continues, Bitcoin might finally break through resistance.
The used output age bands indicator tracks coins moved (or "spent") based on holding periods. High movement of young coins (0-1 day, 1-7 days, 7-30 days) often indicates selling pressure.
Token TA and Market Update: Want more such token insights? Subscribe to editor Harsh Notariya's daily crypto newsletter here.
SOPR, a bottom signal?
The Spent Output Profit Ratio (SOPR) measures whether BTC holders are selling at a profit or loss. It typically peaks when people realize profits at the top and often declines near the bottom when selling at a loss.
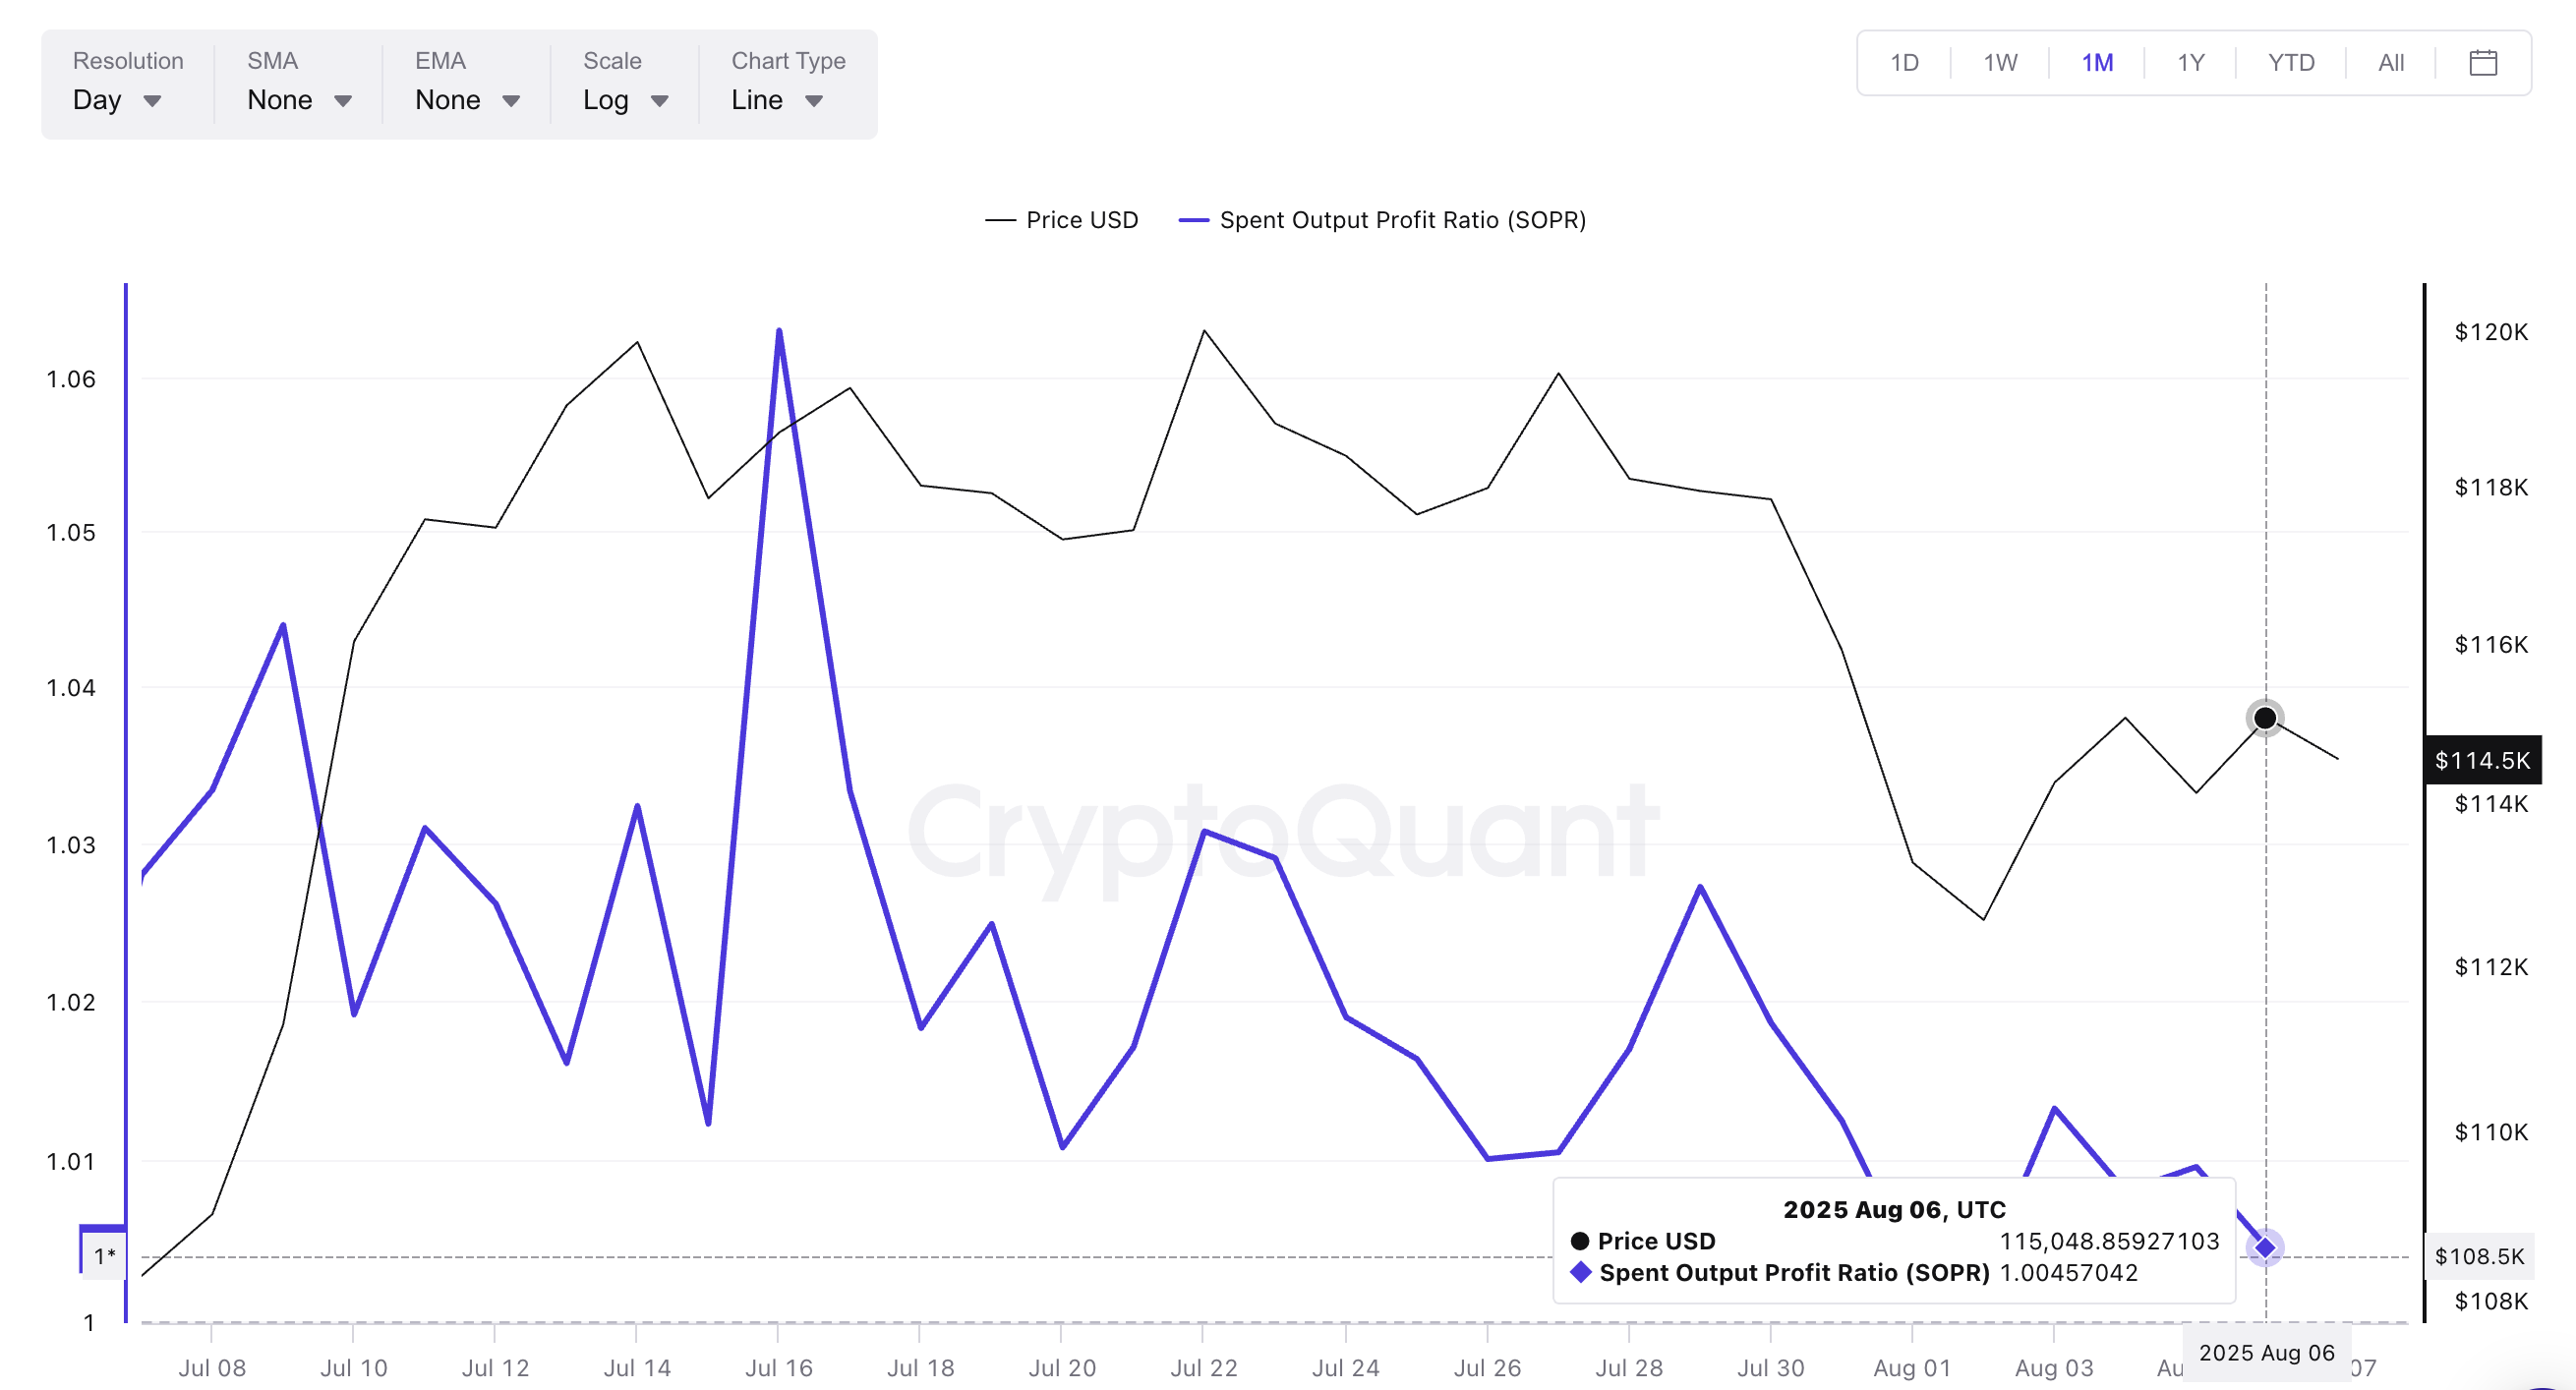
This pattern has occurred several times recently:
- July 16: SOPR reached 1.06, with price peaking around $118,000.
- July 25: SOPR dropped from 1.016 to 1.01, but Bitcoin price actually rose, showing divergence.
- August 5: SOPR declined again, but price rose from $114,000 to $115,000.
This suggests fewer sellers are realizing profits, and some are selling at a loss. When this happens while price remains stable or rises, it often indicates a market bottom is forming.
Bitcoin price pattern still bullish... despite rejection
While Bitcoin price continues to fail breaking the resistance zone near $115,000, one important signal still suggests it might be bullish: the Relative Strength Index (RSI).
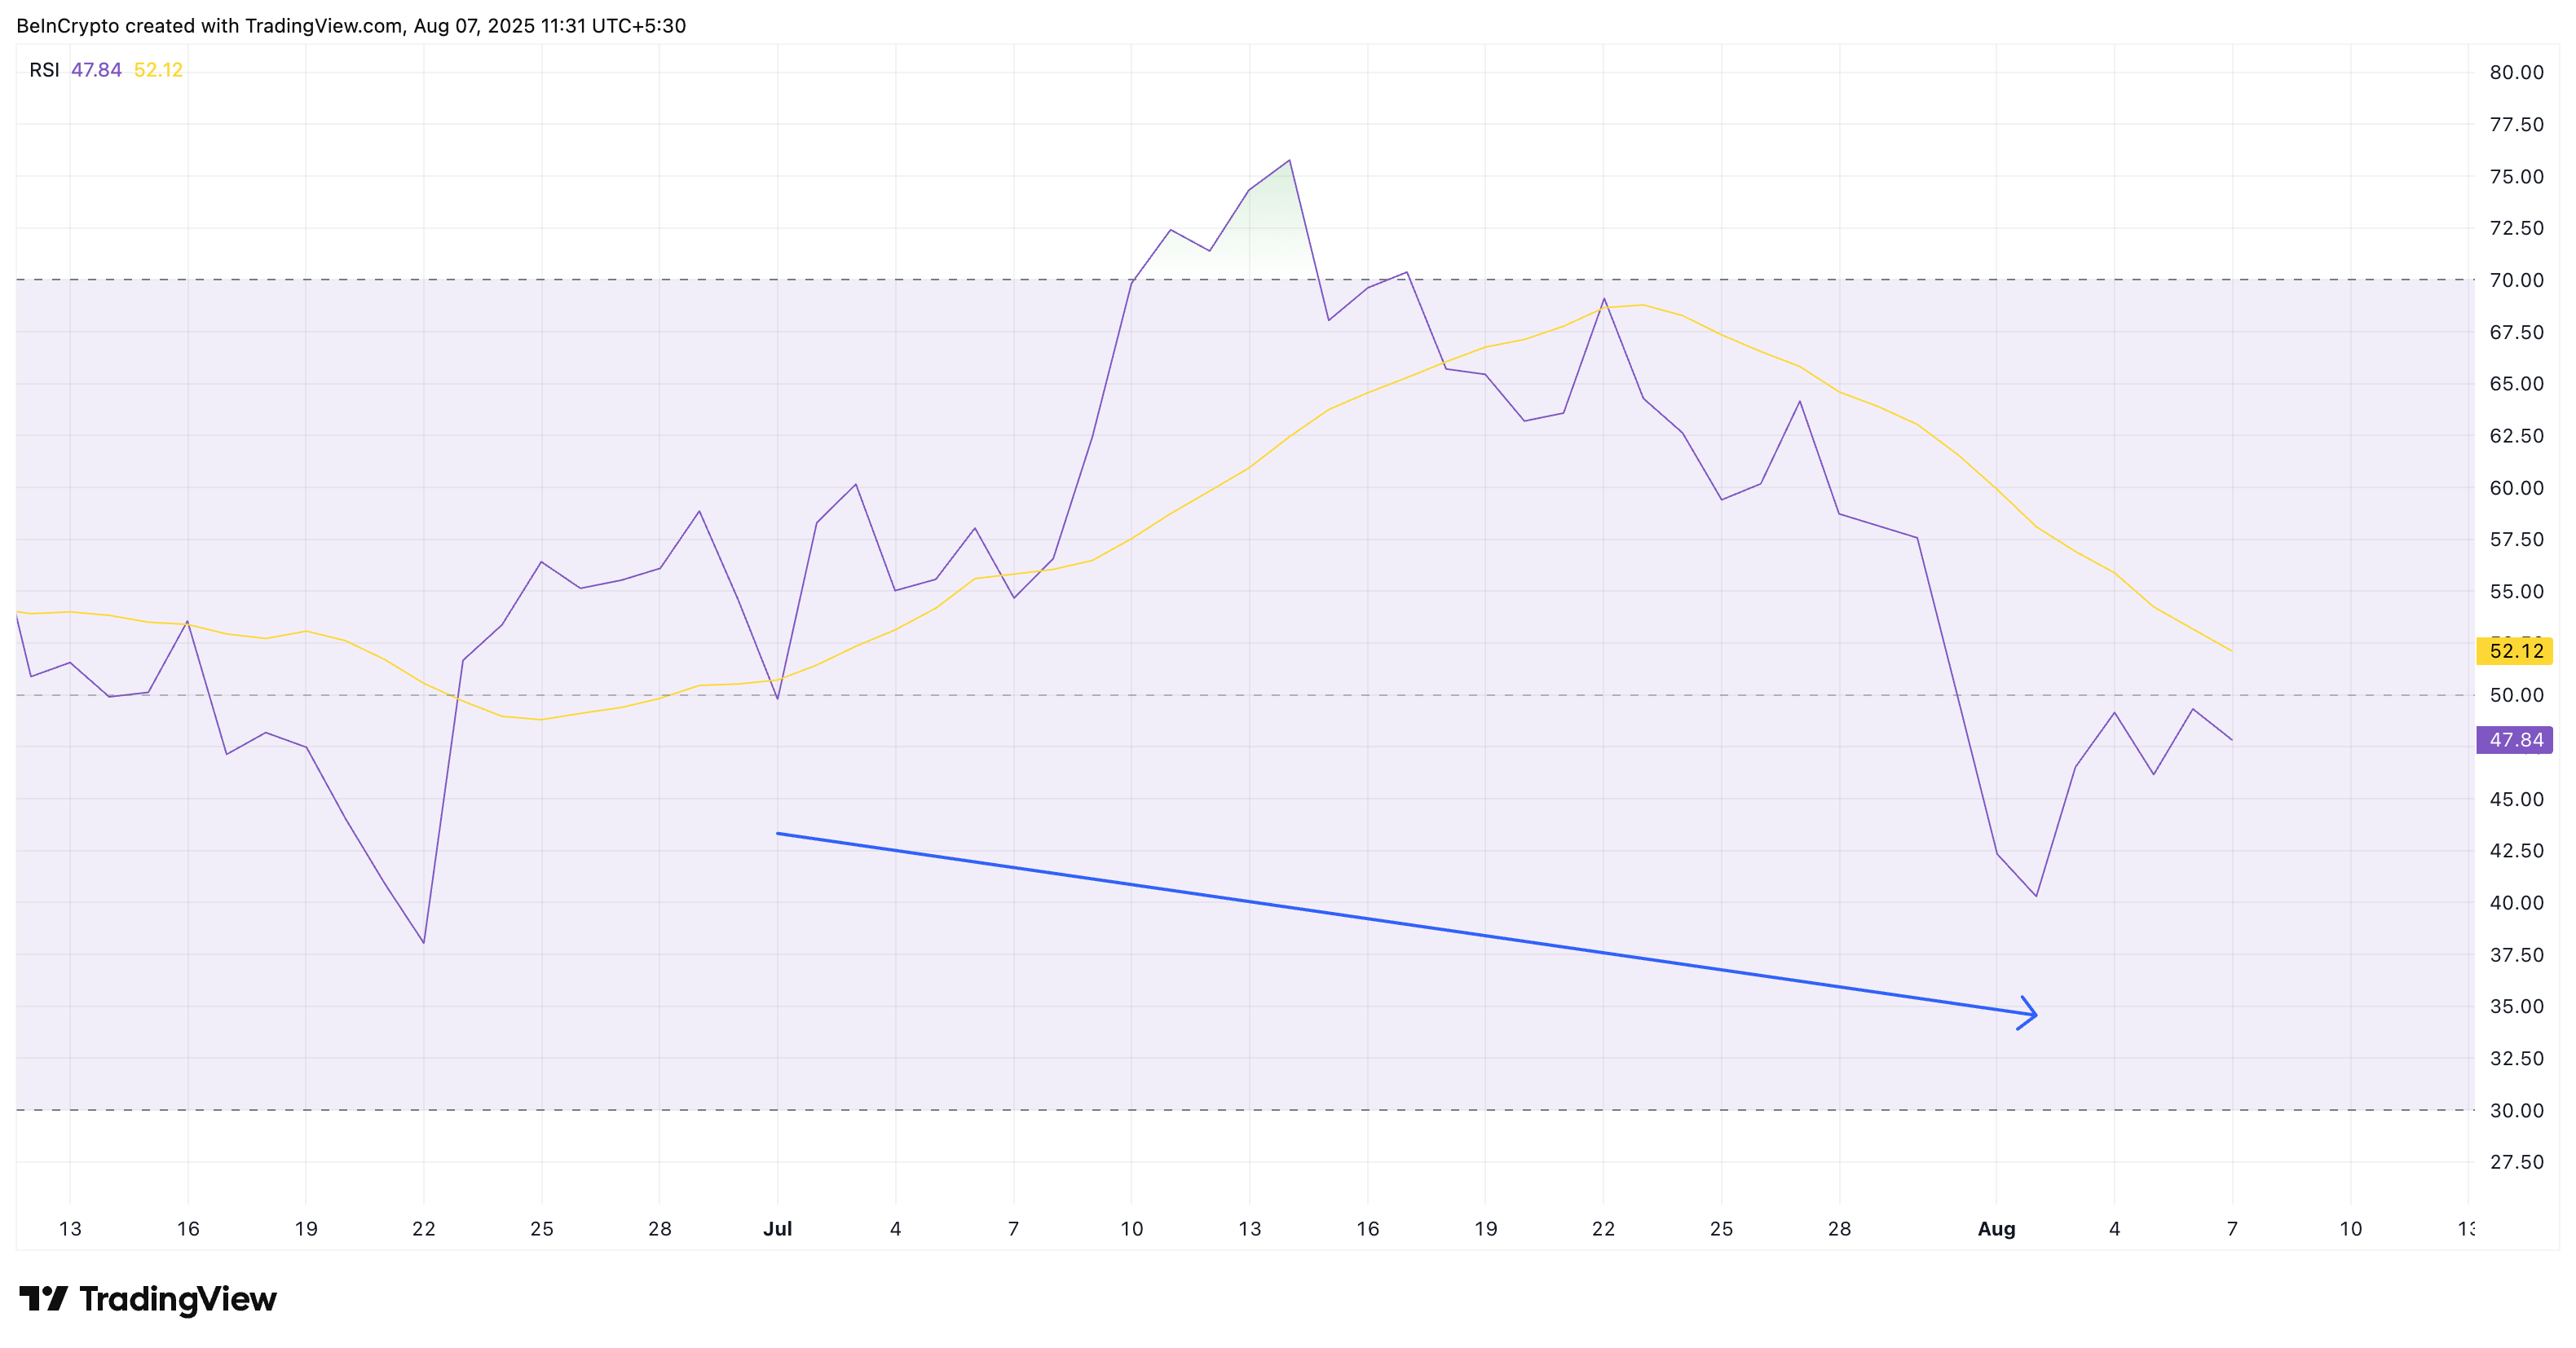
From July 2 to August 2, Bitcoin formed higher lows. This indicates each subsequent decline was not as deep as the previous one, a strong price signal. However, during the same period, RSI recorded lower lows. This is known as a hidden bullish divergence, suggesting momentum is quietly building even if price hasn't significantly risen yet.
The Relative Strength Index (RSI) measures the strength of recent price movements to capture potential trend changes.
So while the price chart seems stagnant, the RSI quietly indicates buyers are still in control, suggesting any breakout could have strong momentum. This indicates the underlying trend remains bullish.
Now combine this with actual chart patterns. Bitcoin is moving within an ascending flag pattern. The key resistance remains at $115,000. This is the line Bitcoin hasn't broken. However, the price is forming higher lows below that level.
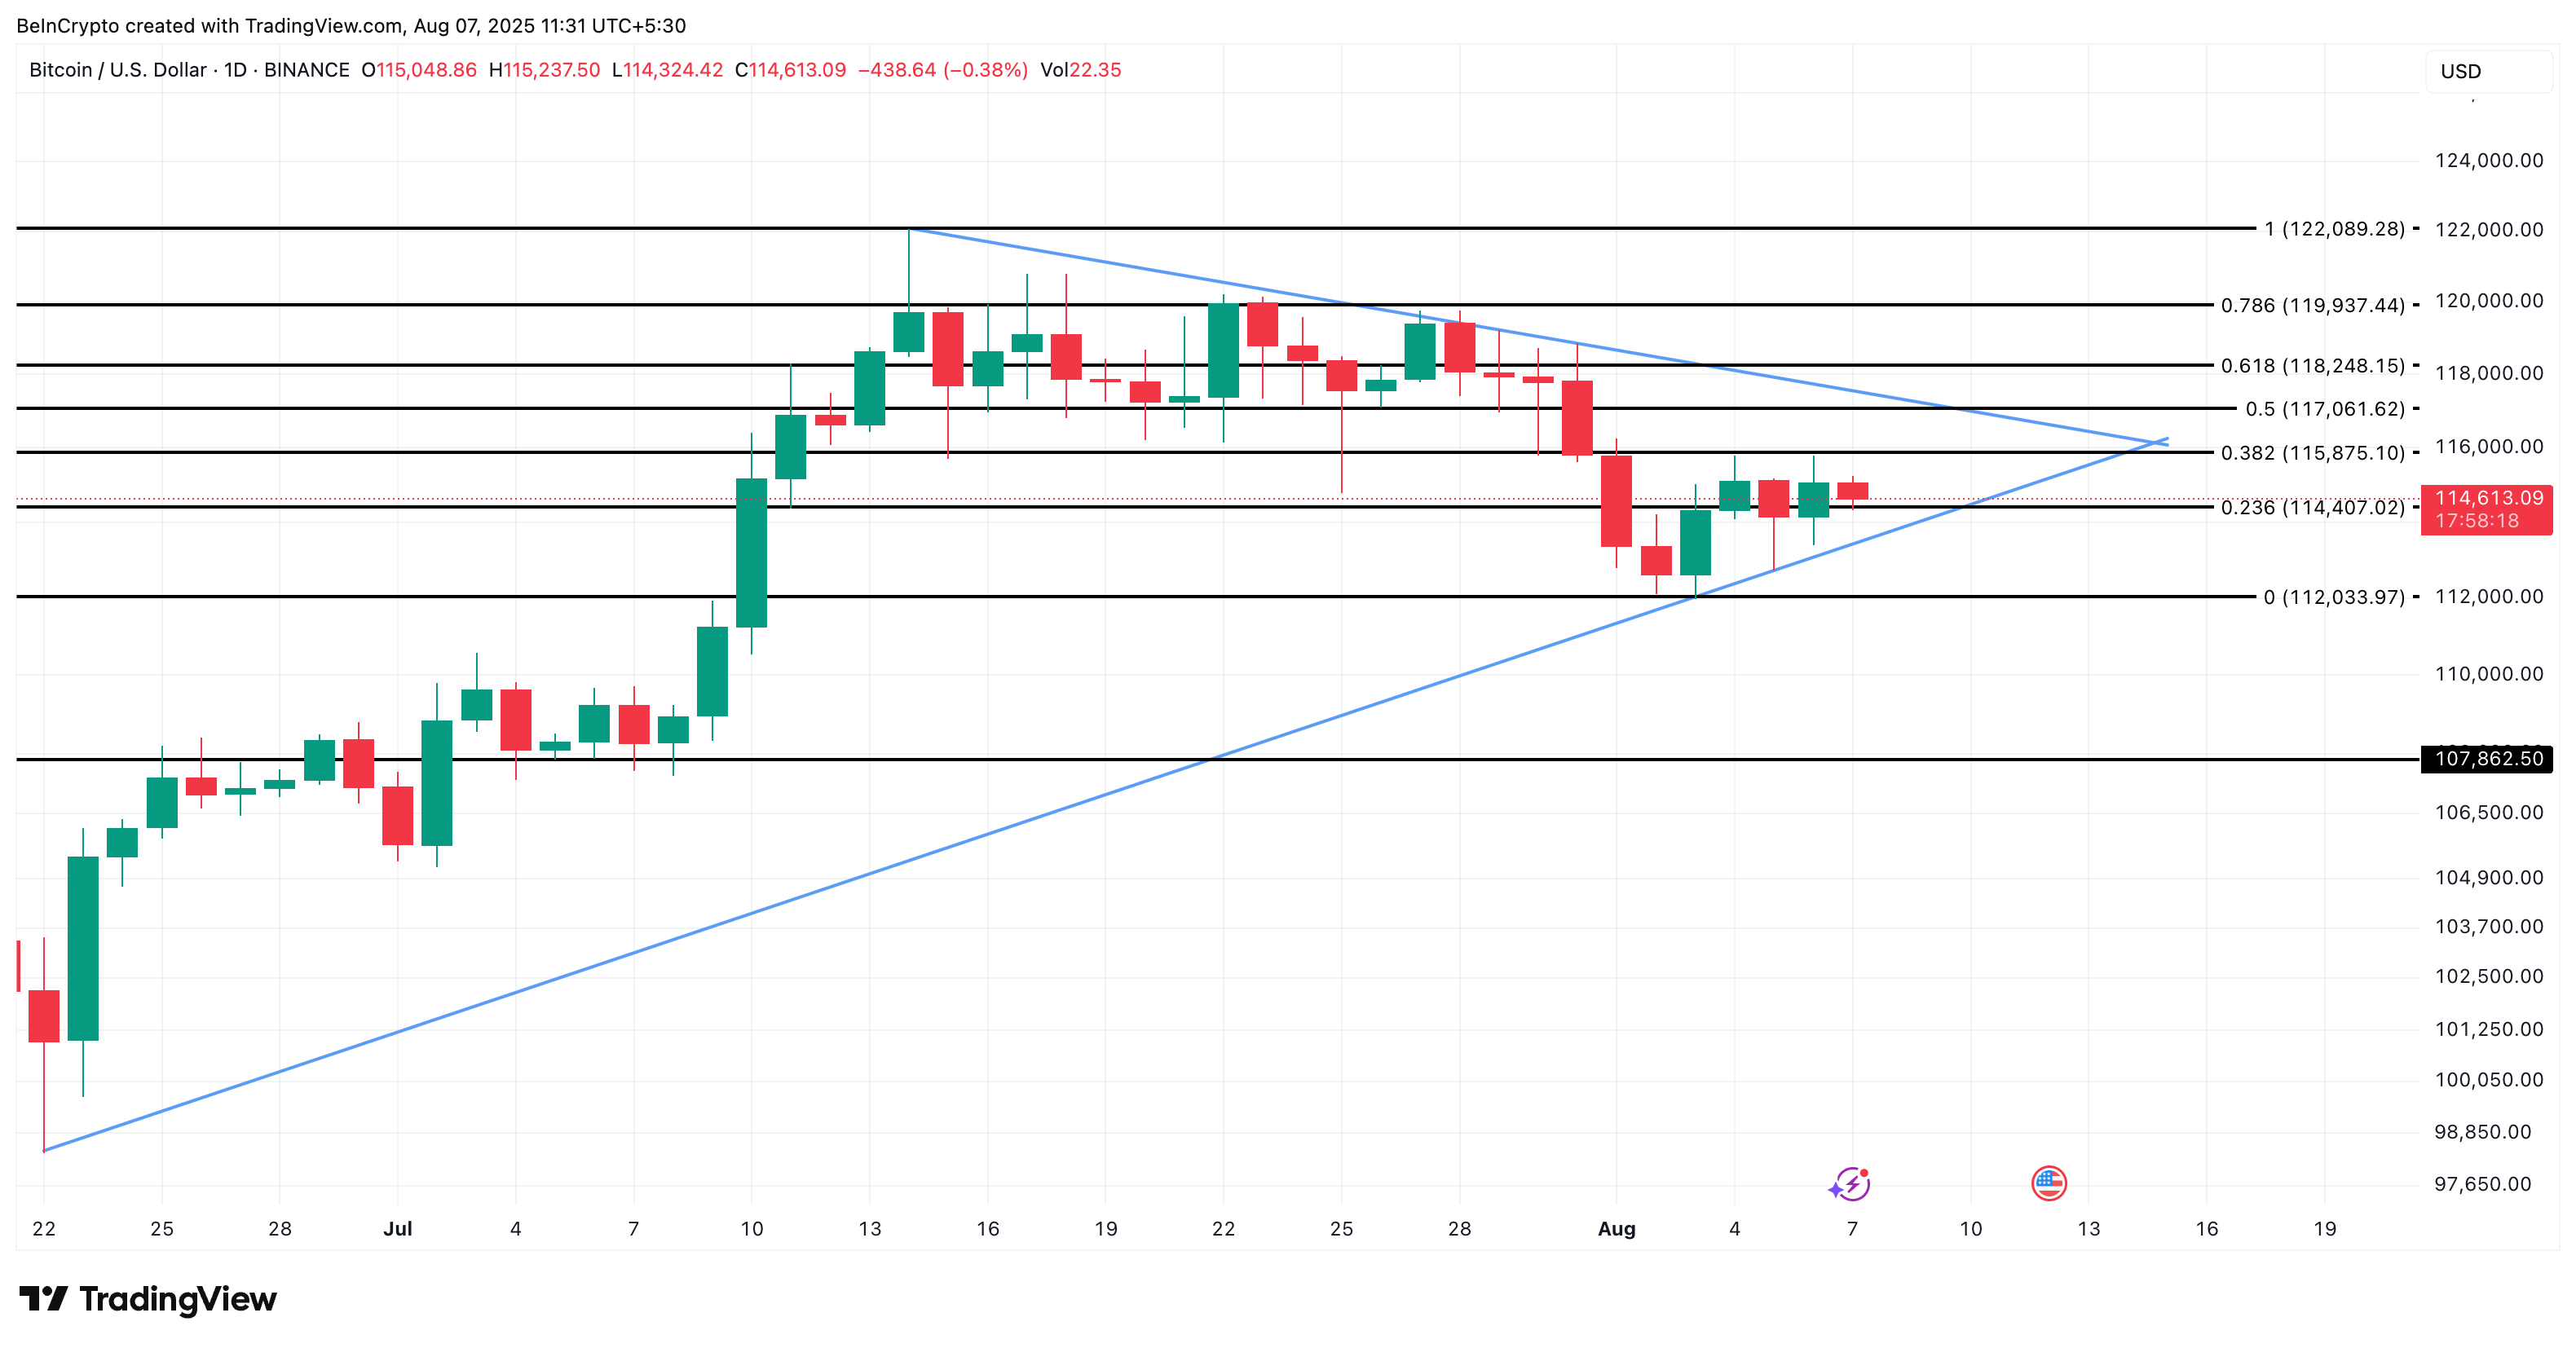
A breakout could be confirmed if Bitcoin closes above $117,000 and especially above $118,000. Invalidation is below $114,000, particularly below $112,000. Falling there could see BTC drop to $107,000, but currently all indicators suggest a short-term bullish formation.