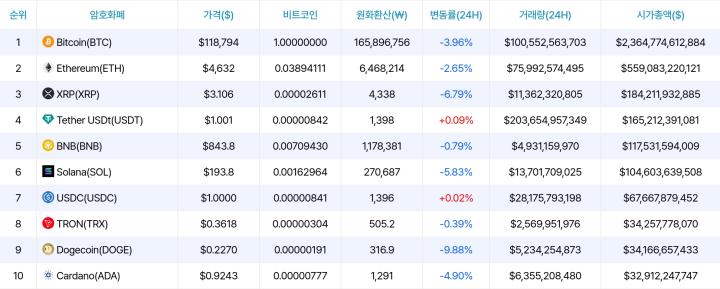
The major cryptocurrency Bitcoin showed high volatility this week with sharp price fluctuations and reaching new record highs. Yesterday, the coin reached a new all-time high of $123,731 before retreating. It is currently trading at $119,937, down about 4% from its peak.
Despite these fluctuations, on-chain data shows holding patterns among Bitcoin's short-term holders (STHs), which could potentially fuel another rise in the coin in the short term.
Short-term Holders, Fuel for Bitcoin's Next Rise?
BTC STHs (investors holding the coin for 155 days or less) have reduced selling and entered an accumulation pattern despite increasing market volatility.
This is reflected in the coin's STH Spent Output Profit Ratio (STH-SOPR) indicator, which briefly dipped below the neutral line but has rebounded, according to glassnode.
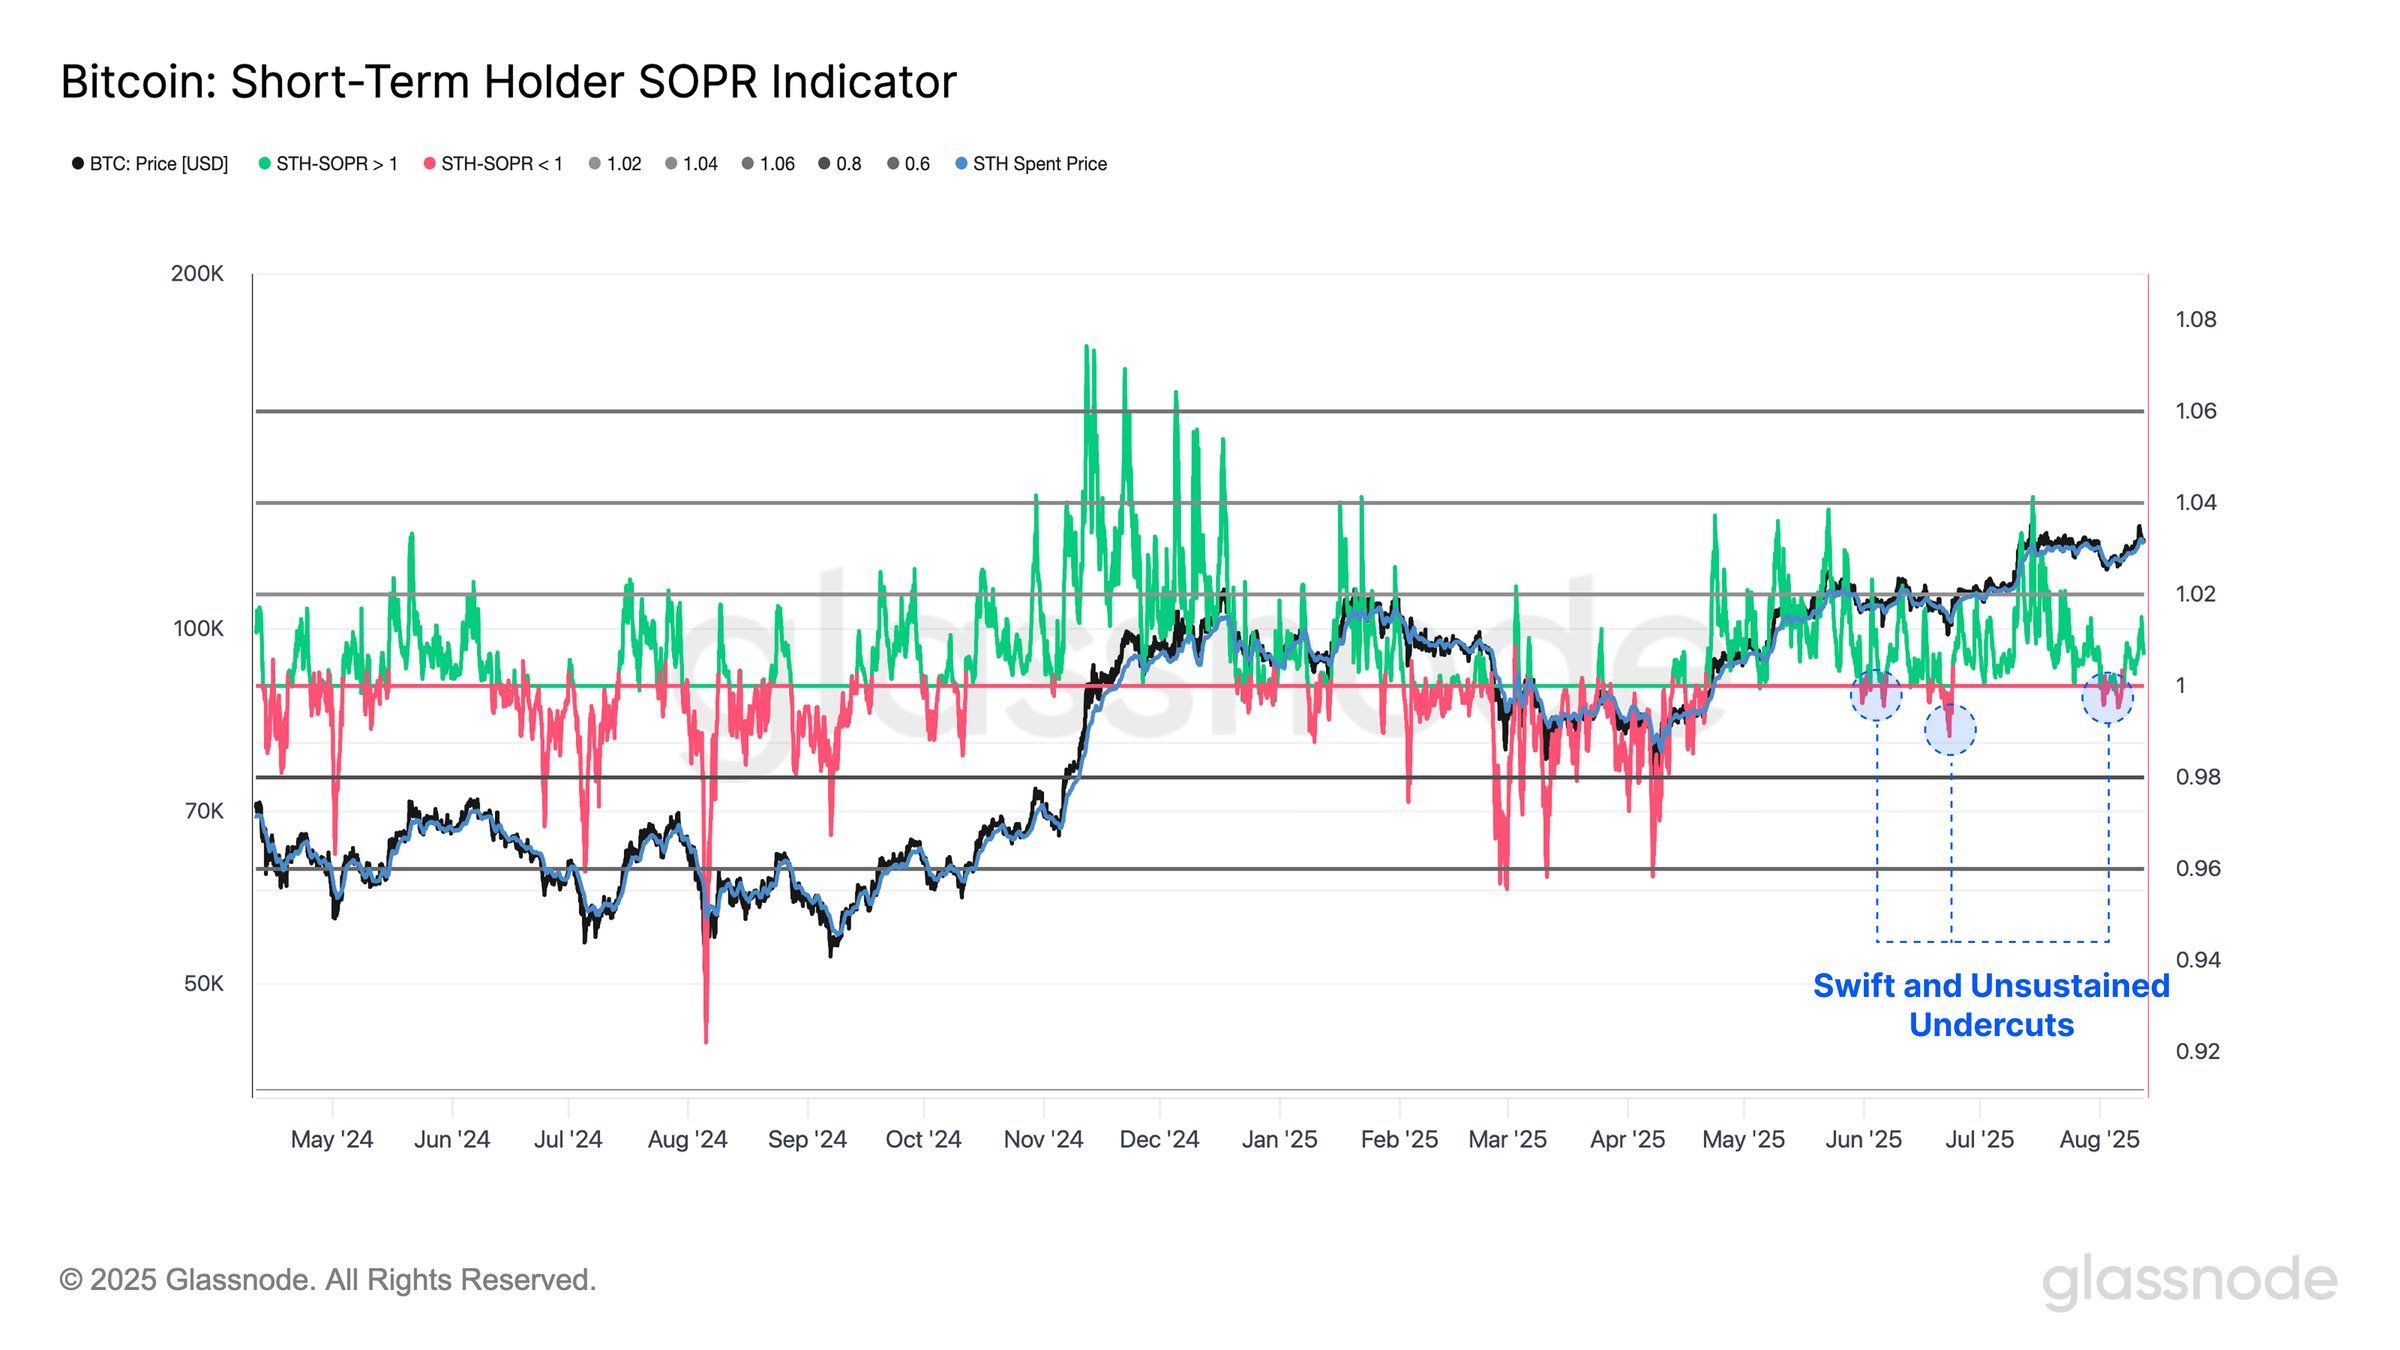
The STH-SOPR indicator measures whether coins moved by STHs are sold at a profit or loss. Staying above the neutral line indicates STHs are selling at a profit, showing strong market sentiment. Conversely, falling below 1 suggests these investors are distributing coins at a loss.
BTC's STH-SOPR movement crossing the neutral line is noteworthy. STHs are among the most influential participants in BTC price movements. Their cost basis is often close to the current market price, so STHs react first to fluctuations. They can worsen selling during declines or improve rallies during holding or accumulation.
Therefore, their decision to return to holding patterns despite sharp price changes may reflect a degree of confidence that could help stabilize the market.
Bitcoin Aggressive Buyers Absorb Selling Pressure
Bitcoin's taker buy/sell ratio rose to a monthly high of 1.16, confirming bullish sentiment among derivatives traders.
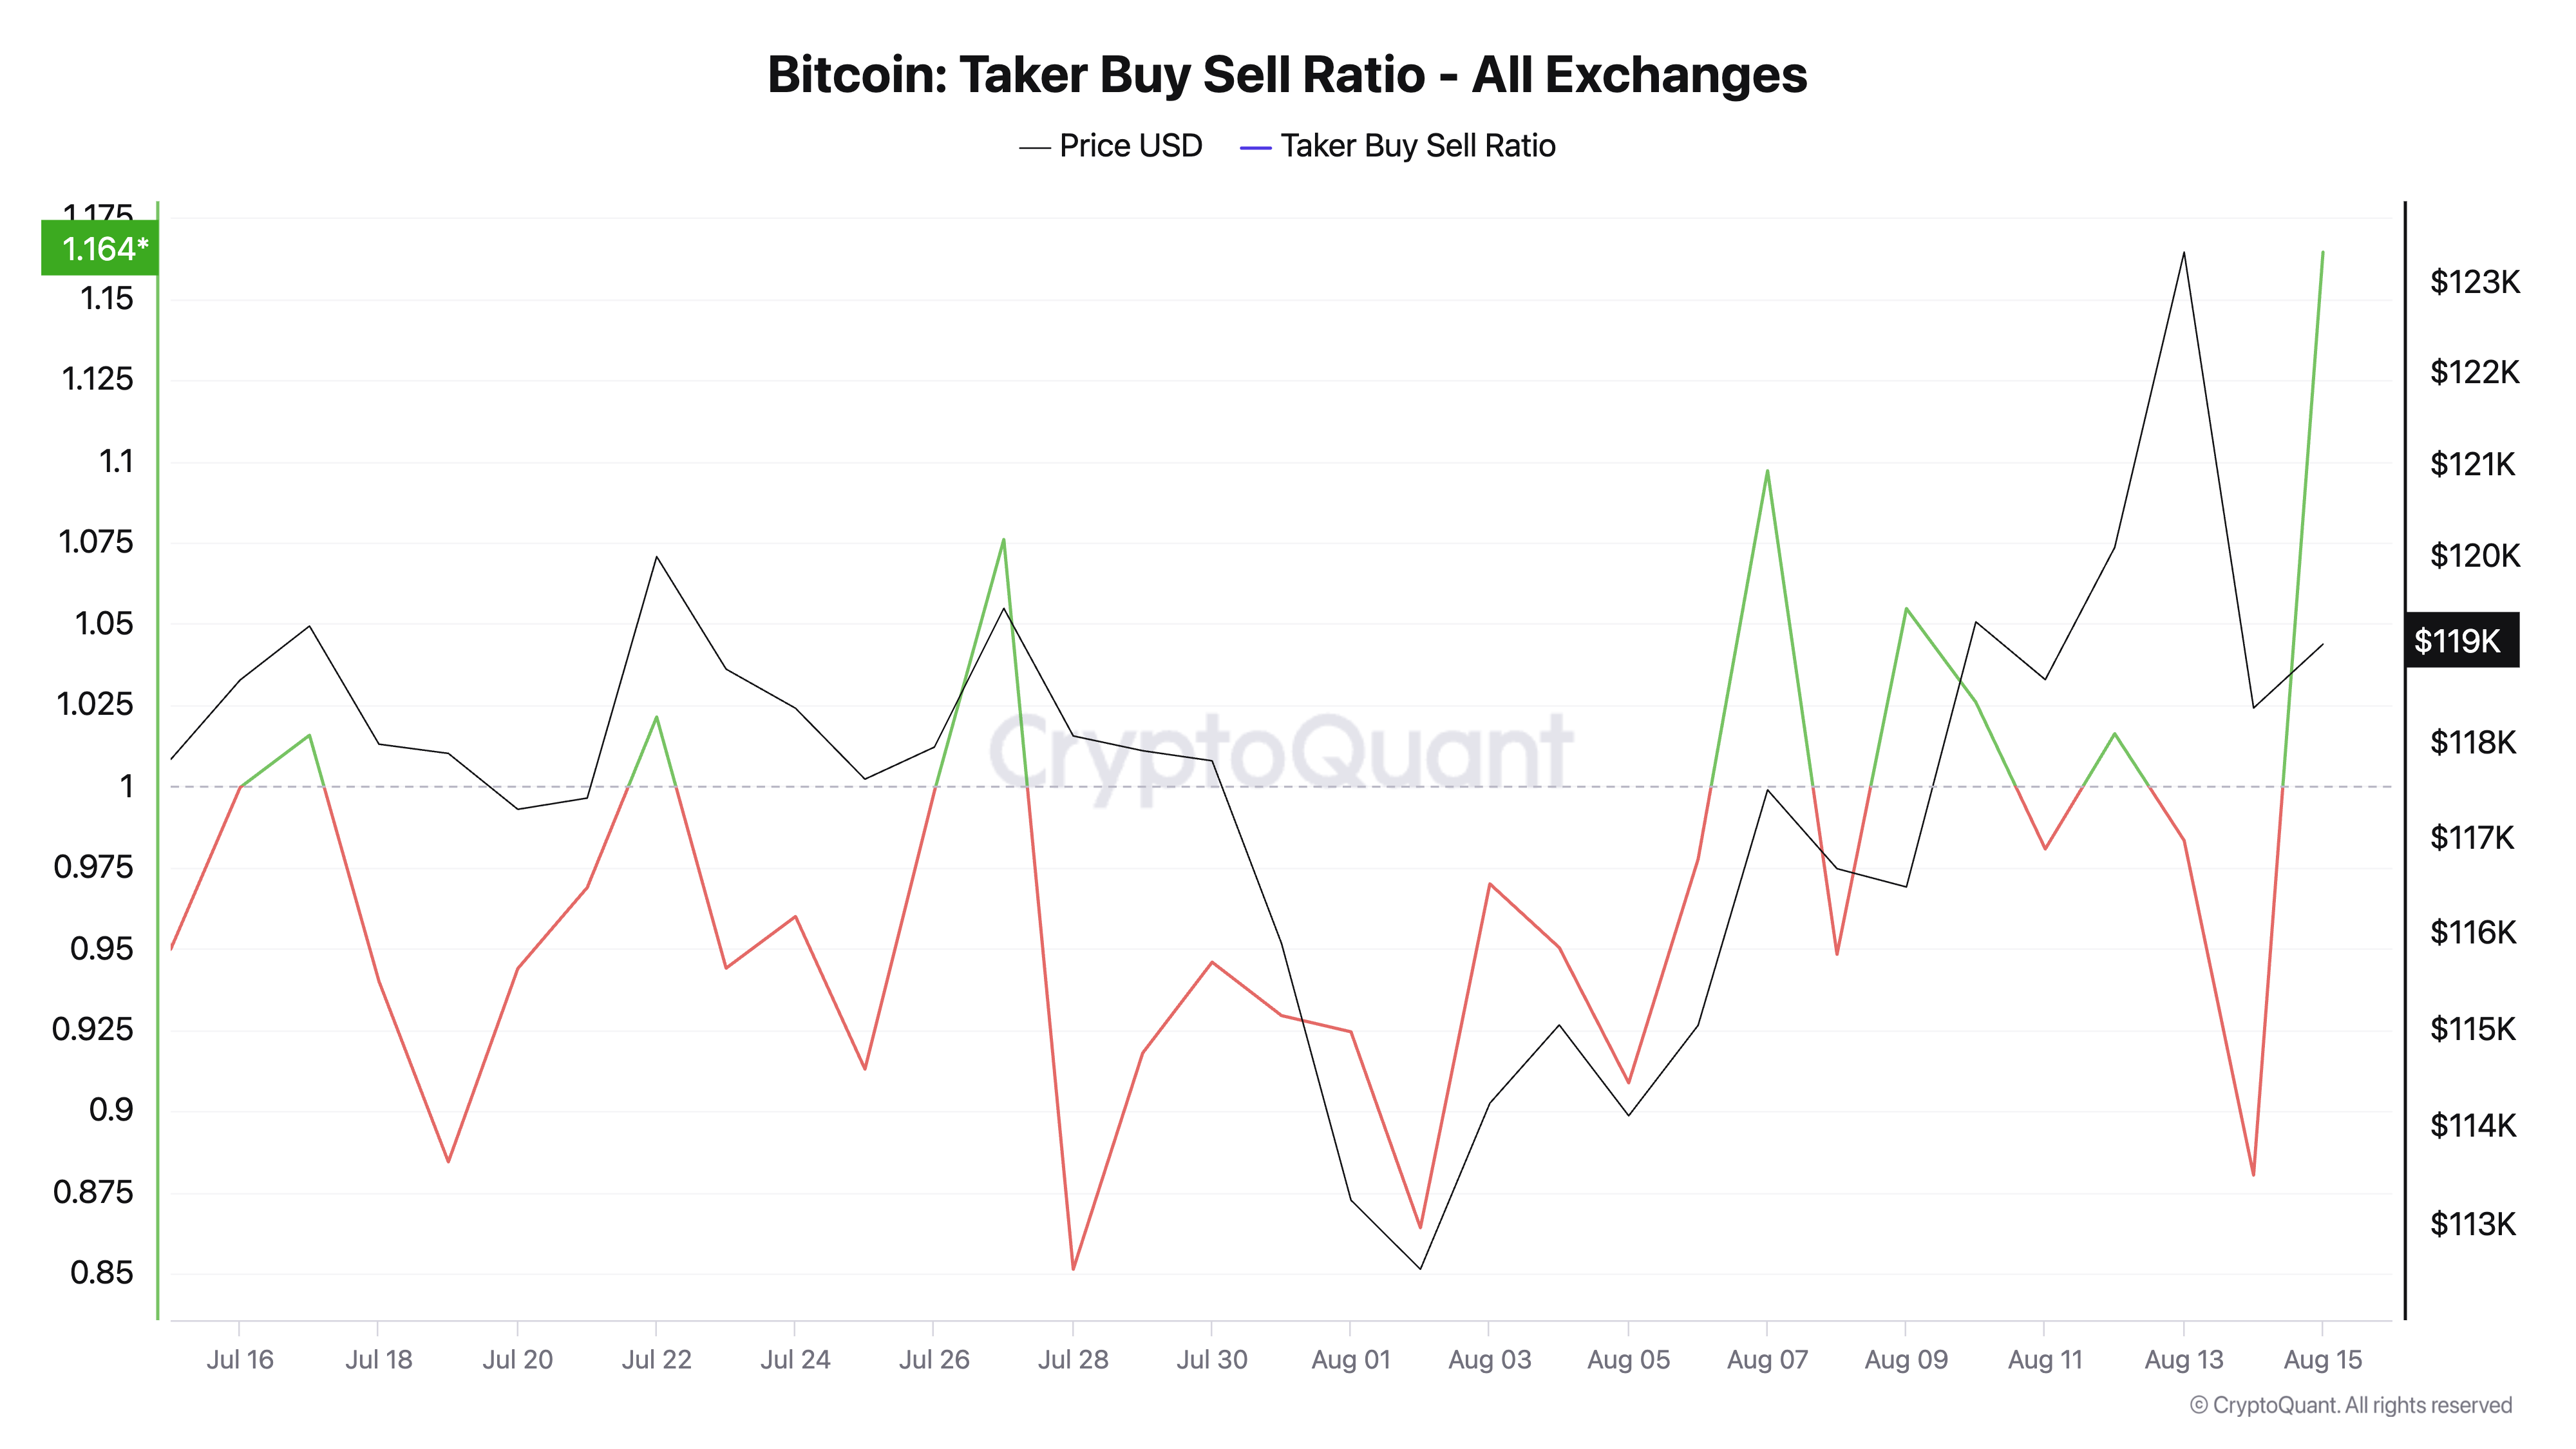
This ratio measures the balance between market buy and sell orders in futures and perpetual contracts. A value above 1 means more trades are executed at buying prices (market buy), indicating the aggressiveness of buyers.
BTC's current taker buy/sell ratio suggests derivatives market buyers are actively absorbing sell-side liquidity. This demonstrates increased demand and could potentially trigger a rebound by emphasizing strong confidence.
Will it Break $122,000 or Drop to $115,000?
If this trend continues, Bitcoin BTC could retest the $122,000 level in the near term. Breaking the $122,190 resistance could trigger a rally to the all-time high of $123,731.
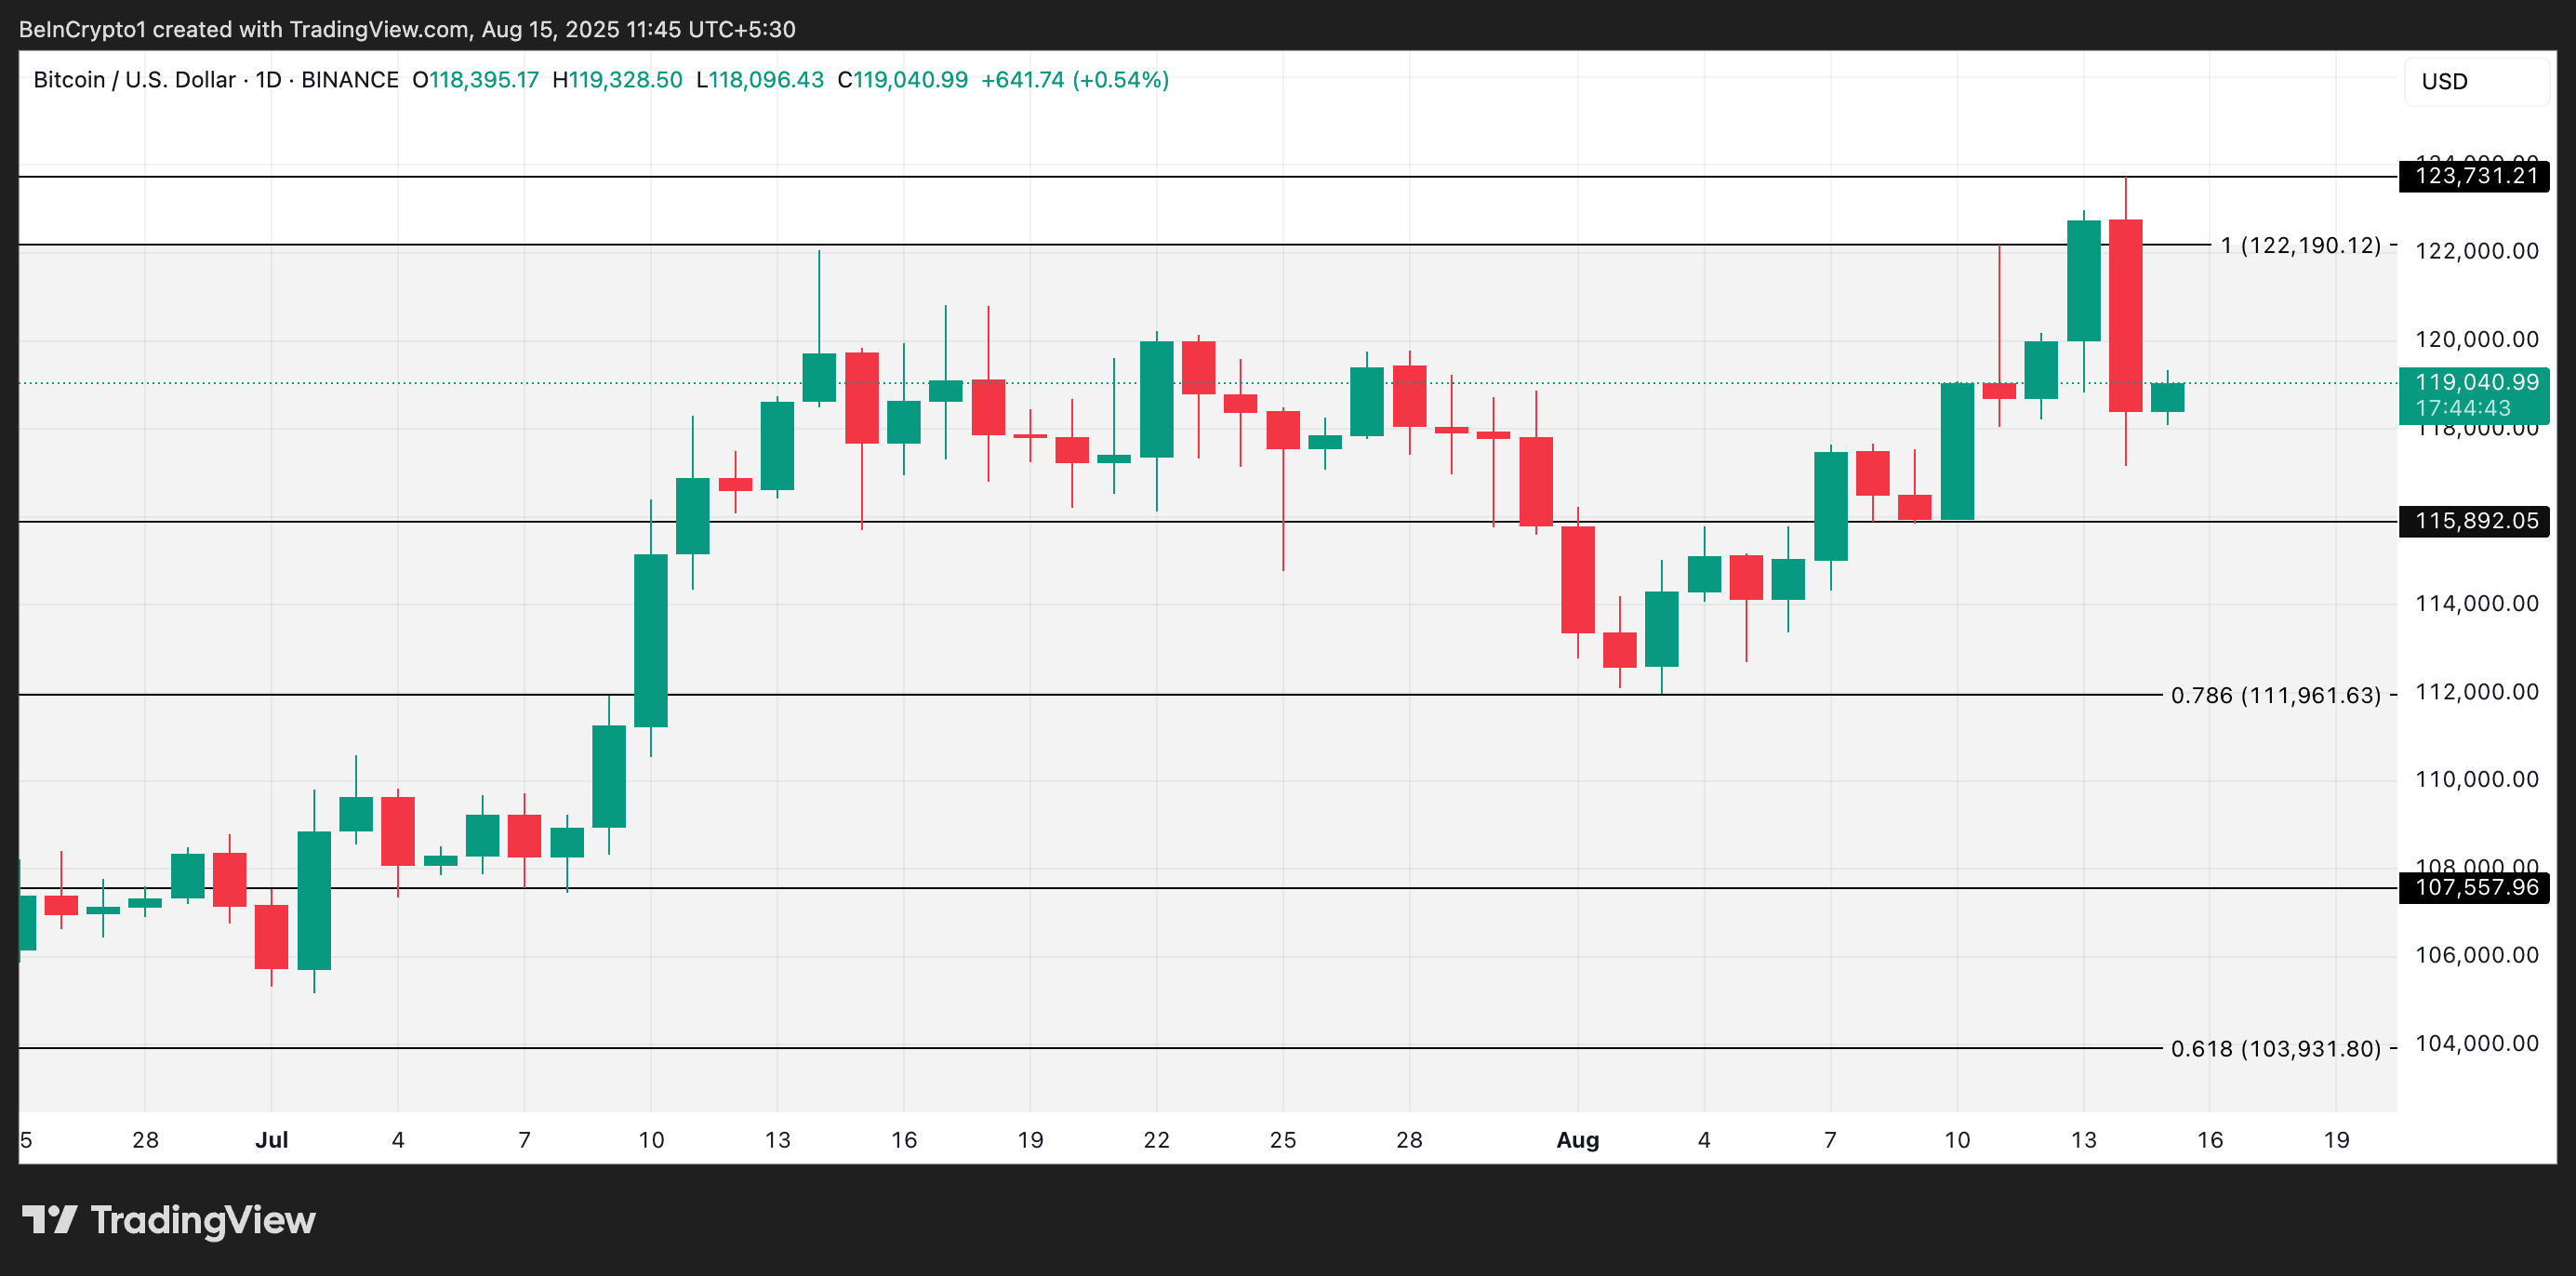
However, if volatility intensifies and bullish confidence weakens, selling pressure could increase, potentially causing the price to drop to $115,892.