The Notcoin price dropped nearly 14% last week and fell 28% over the past three months. It did not participate in the broader market rally and is currently 19.4% higher than its all-time low.
Mass selling near this level is almost not a positive signal. However, upon closer examination, there are two indicators that could work in Notcoin's favor.
Whale Buying and Increased Exchange Inflows... Panic Selling
Over the past 7 days, exchange inflows increased by 6.5%, reaching a total exchange balance of 3.039 billion NOT. This indicates retail-driven selling pressure, especially as the Notcoin price approaches its all-time low.
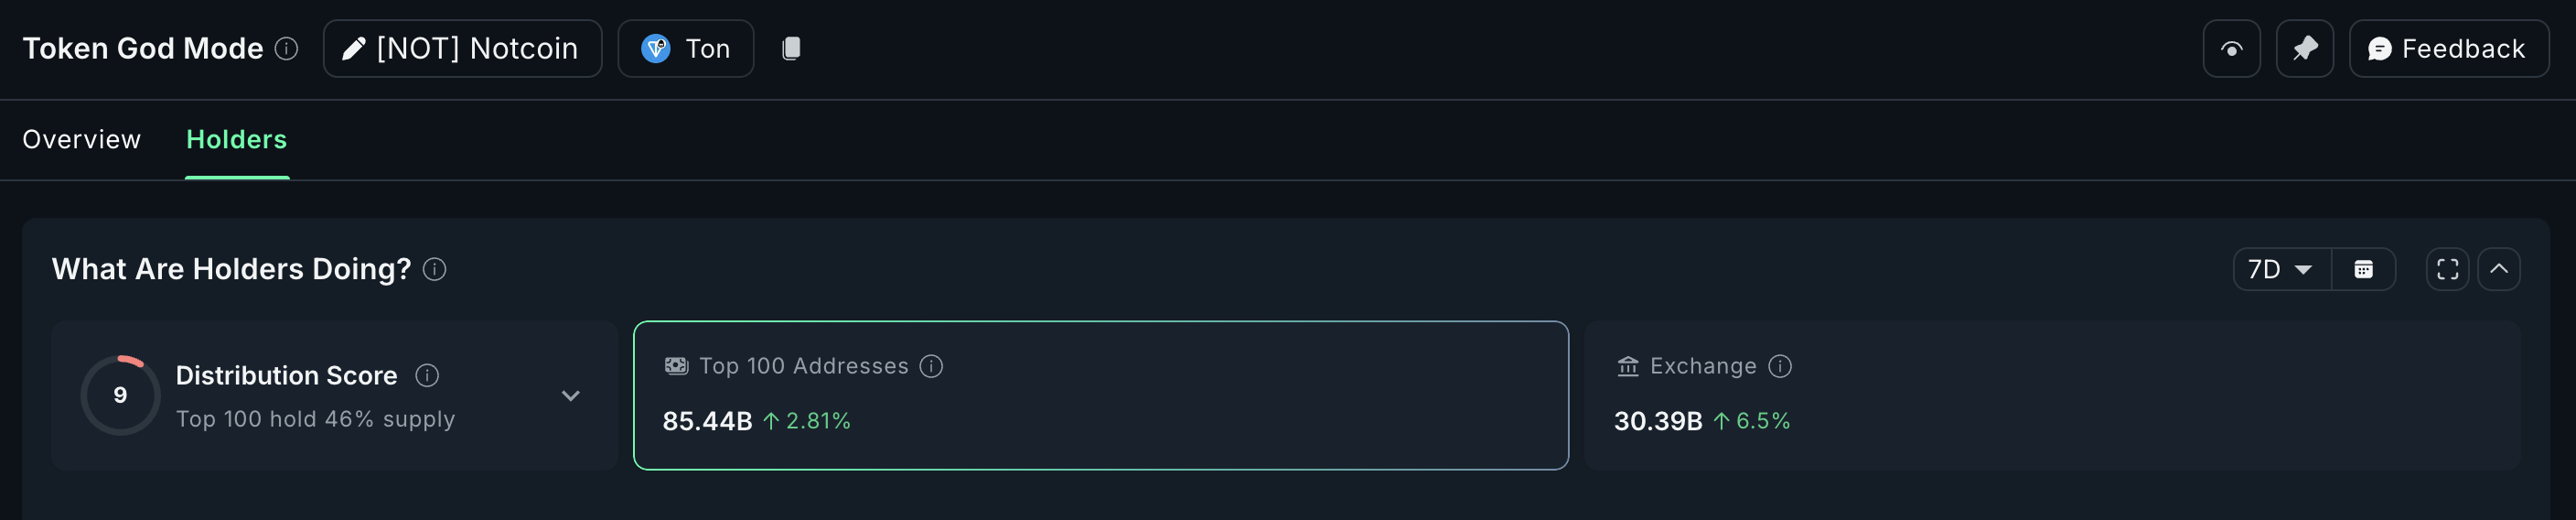
Interestingly, the top 100 addresses were net buyers during this period. If these large holders continue to accumulate and exchange inflows decrease, eventually turning into outflows, market sentiment could change.
However, currently, selling pressure near the bottom remains the dominant force, with buyers in a defensive position. Daily timeframes show increasing selling momentum, indicating that sellers are still driving the momentum.
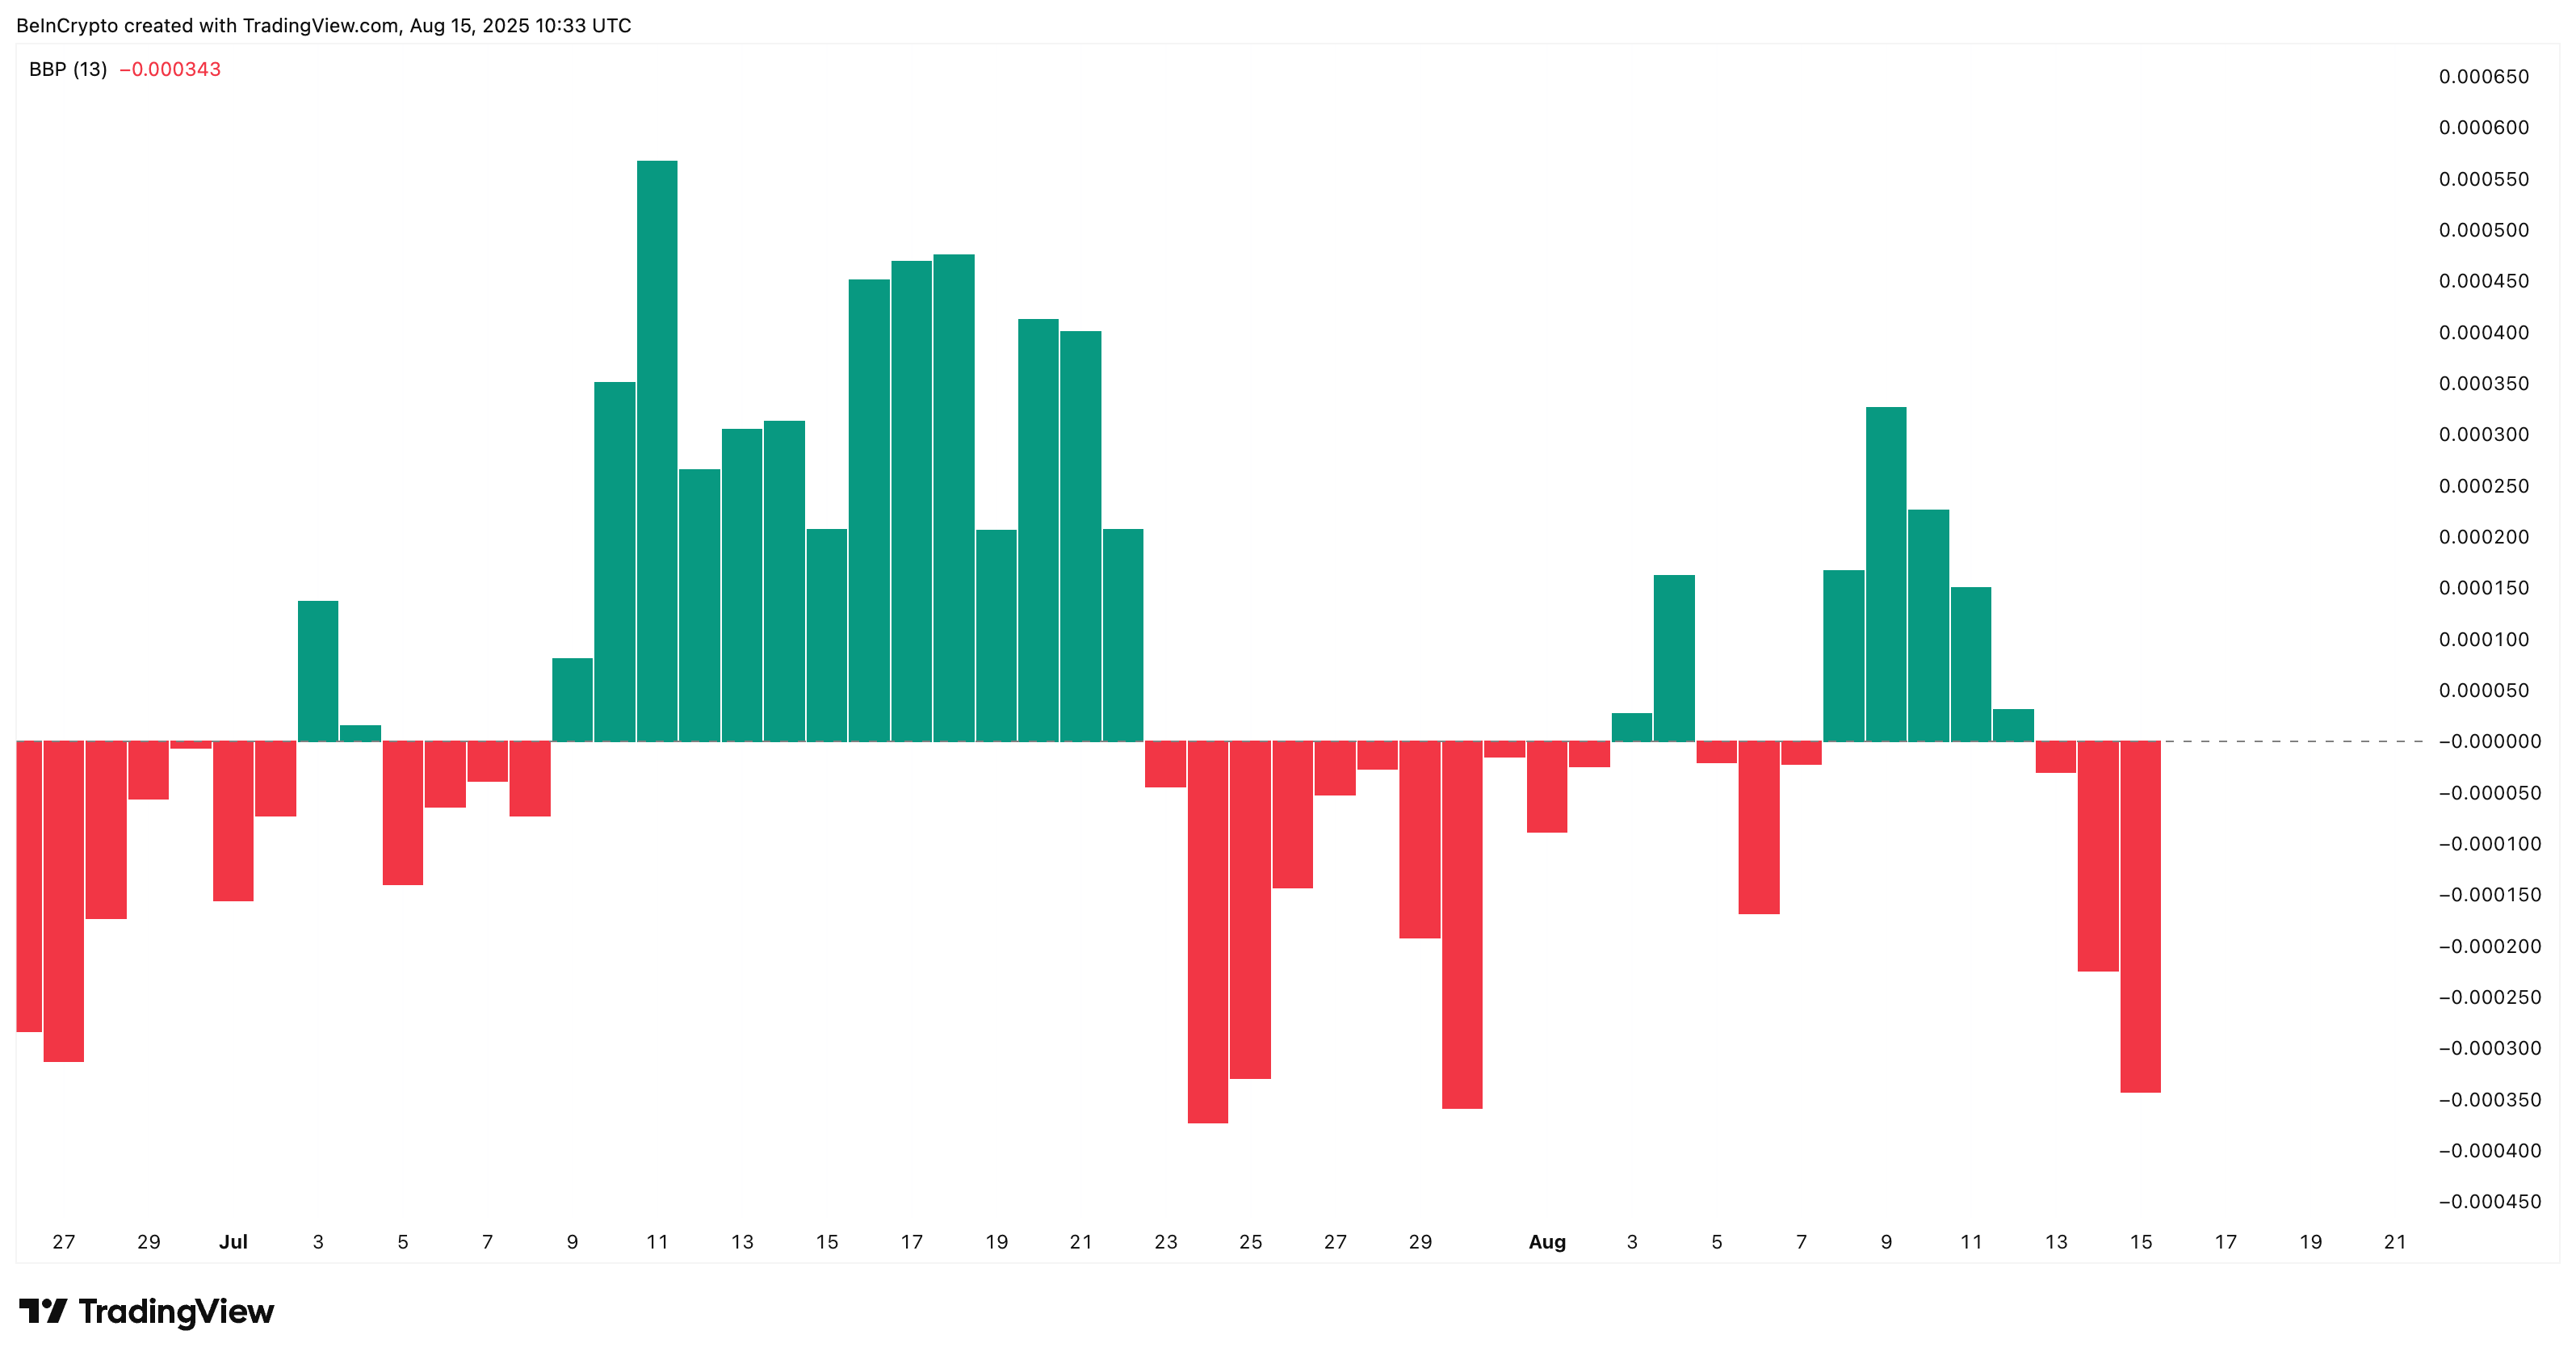
The Bull-Bear Power indicator is a technical analysis tool that measures buying and selling pressure in the market.
Token TA and Market Update: Want more such token insights? Subscribe to editor Harshi Notariya's daily crypto newsletter here.
Death Cross Risk Imminent
The technical setup of Notcoin is sending major warning signals. Several death crosses formed on the 4-hour chart during recent sessions, each indicating sharp price declines. Another death cross is approaching, with the 100-period moving average (light blue line) about to cross below the 200-period moving average (dark blue line).
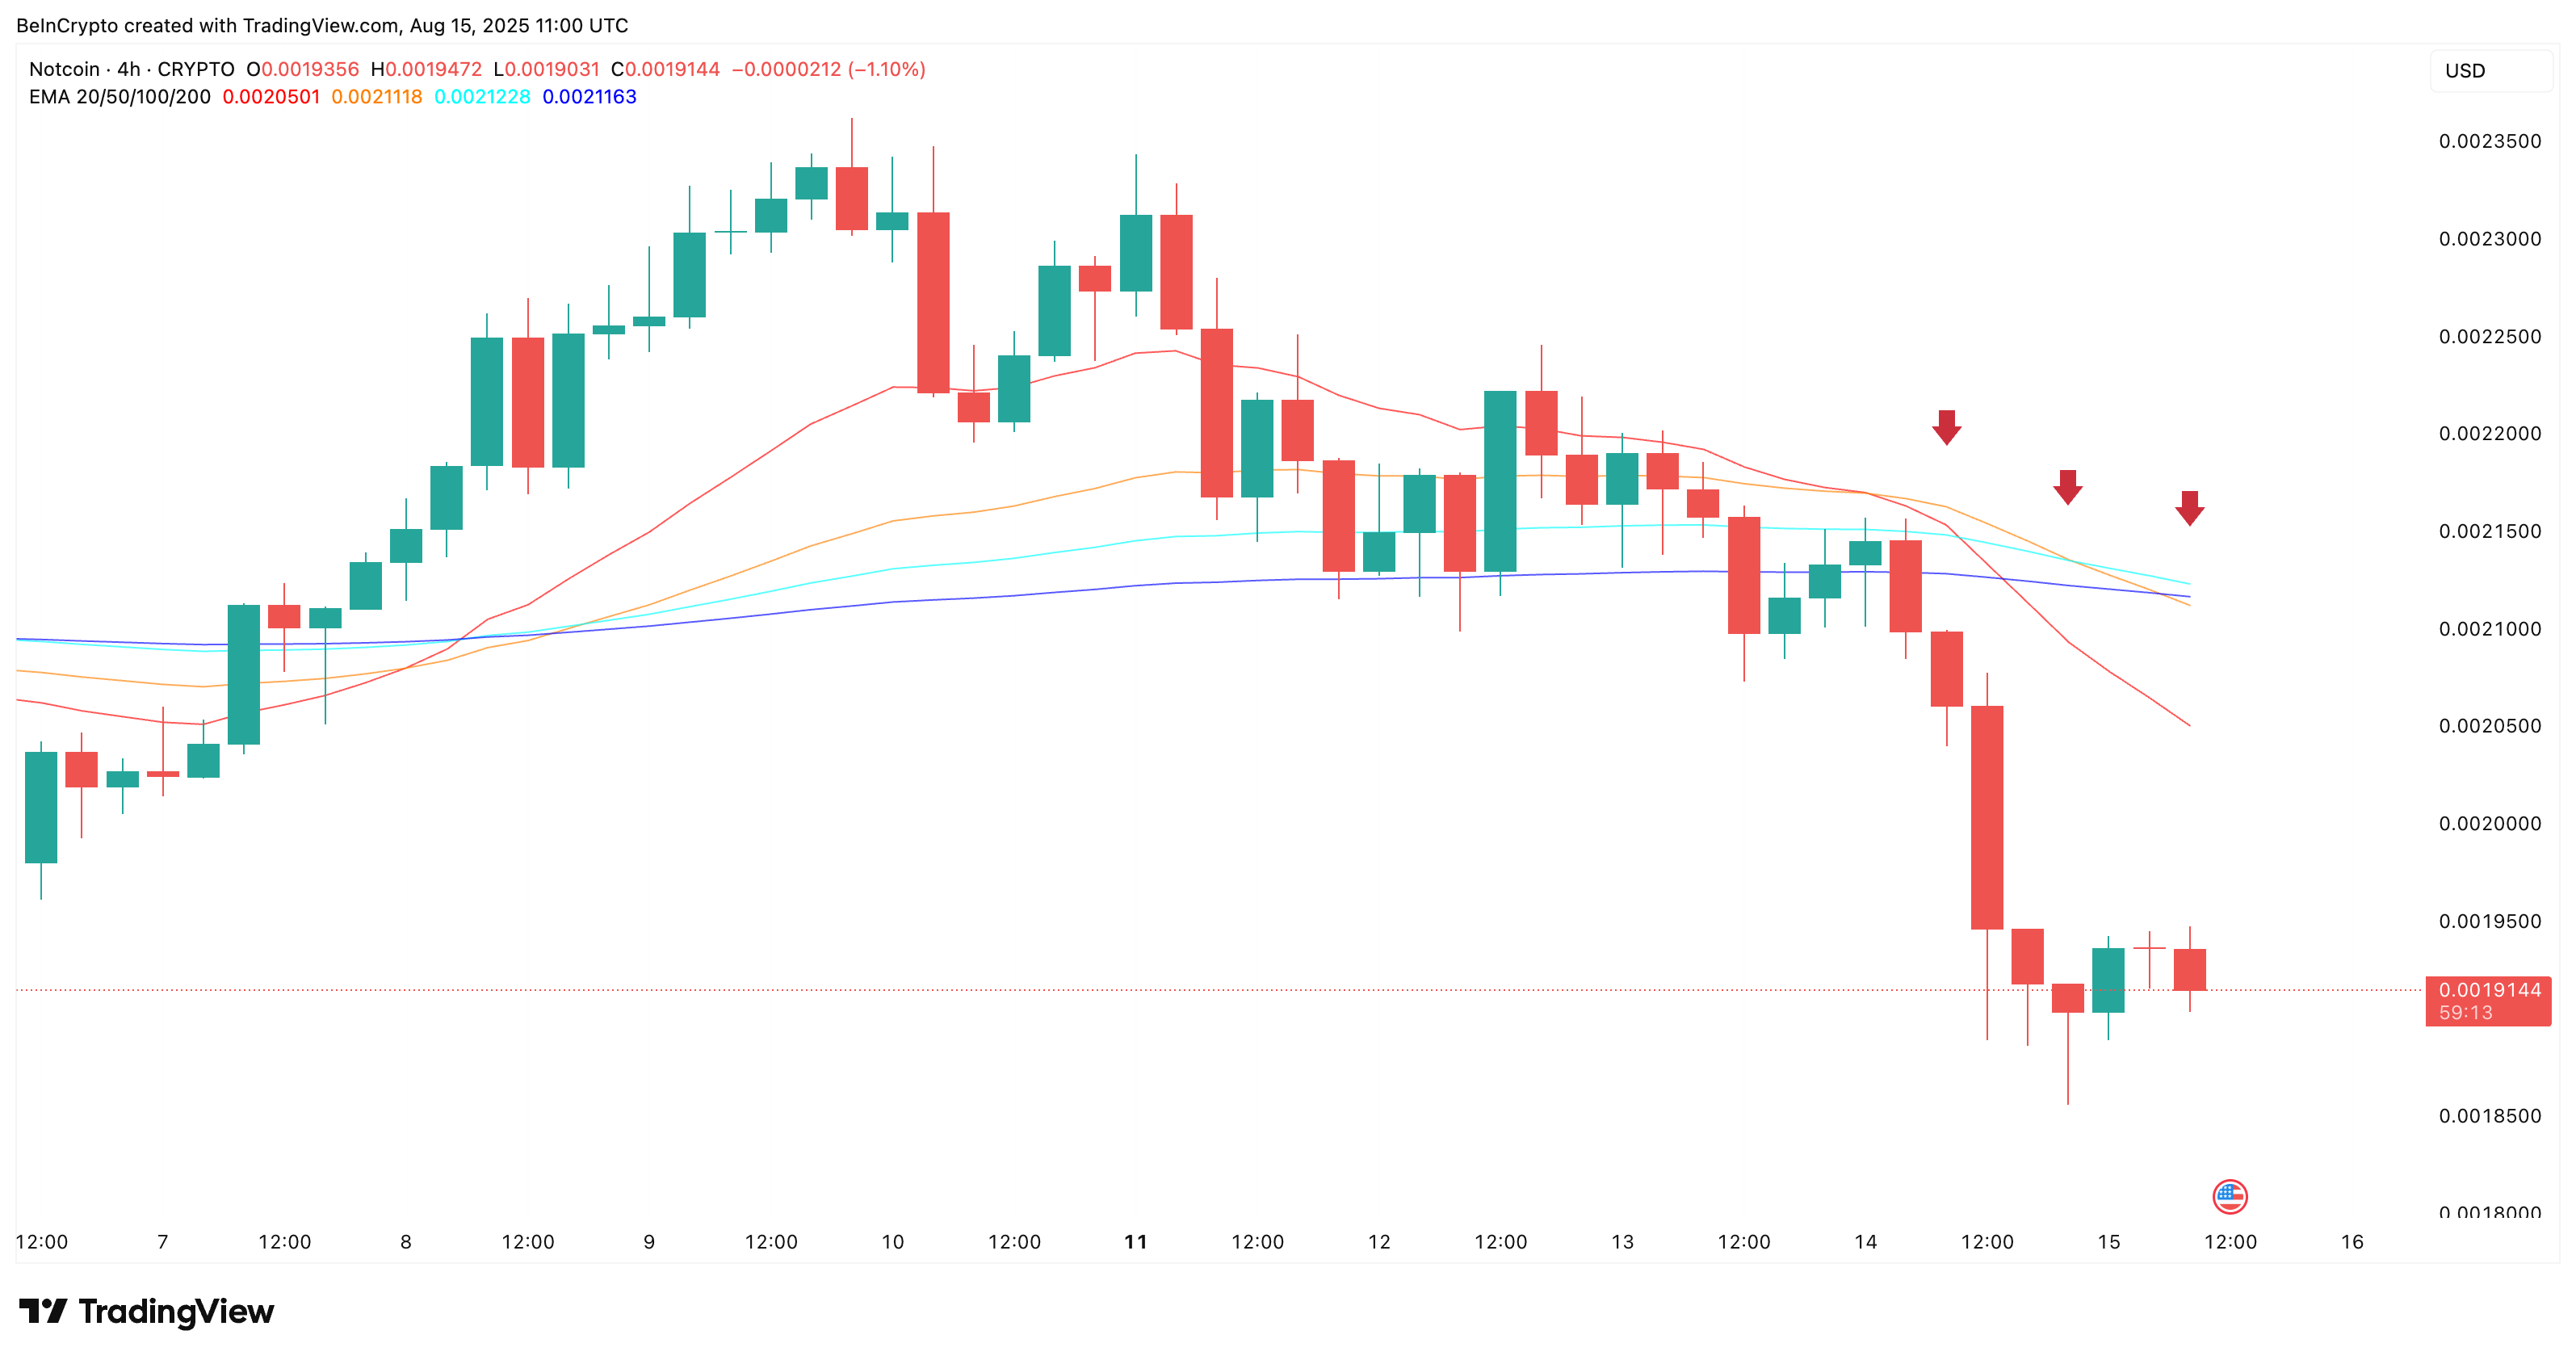
If this crossover is confirmed while exchange inflows remain high, the path to retesting $0.0018 or setting a new all-time low could accelerate. This chart structure reflects the same decline momentum prior to previous drops, reinforcing short-term risk.
Exponential Moving Averages (EMA) track price trends but give more weight to recent data. The crossover occurs when the short-term EMA crosses the long-term EMA, indicating a potential trend change.
Notcoin Price Chart, One Remaining Bullish Divergence
The only positive signal on the chart comes from the Chaikin Money Flow (CMF). Between August 5th and 14th, while the price recorded lower lows, the CMF recorded higher lows. This is an initial signal that selling pressure might ease.
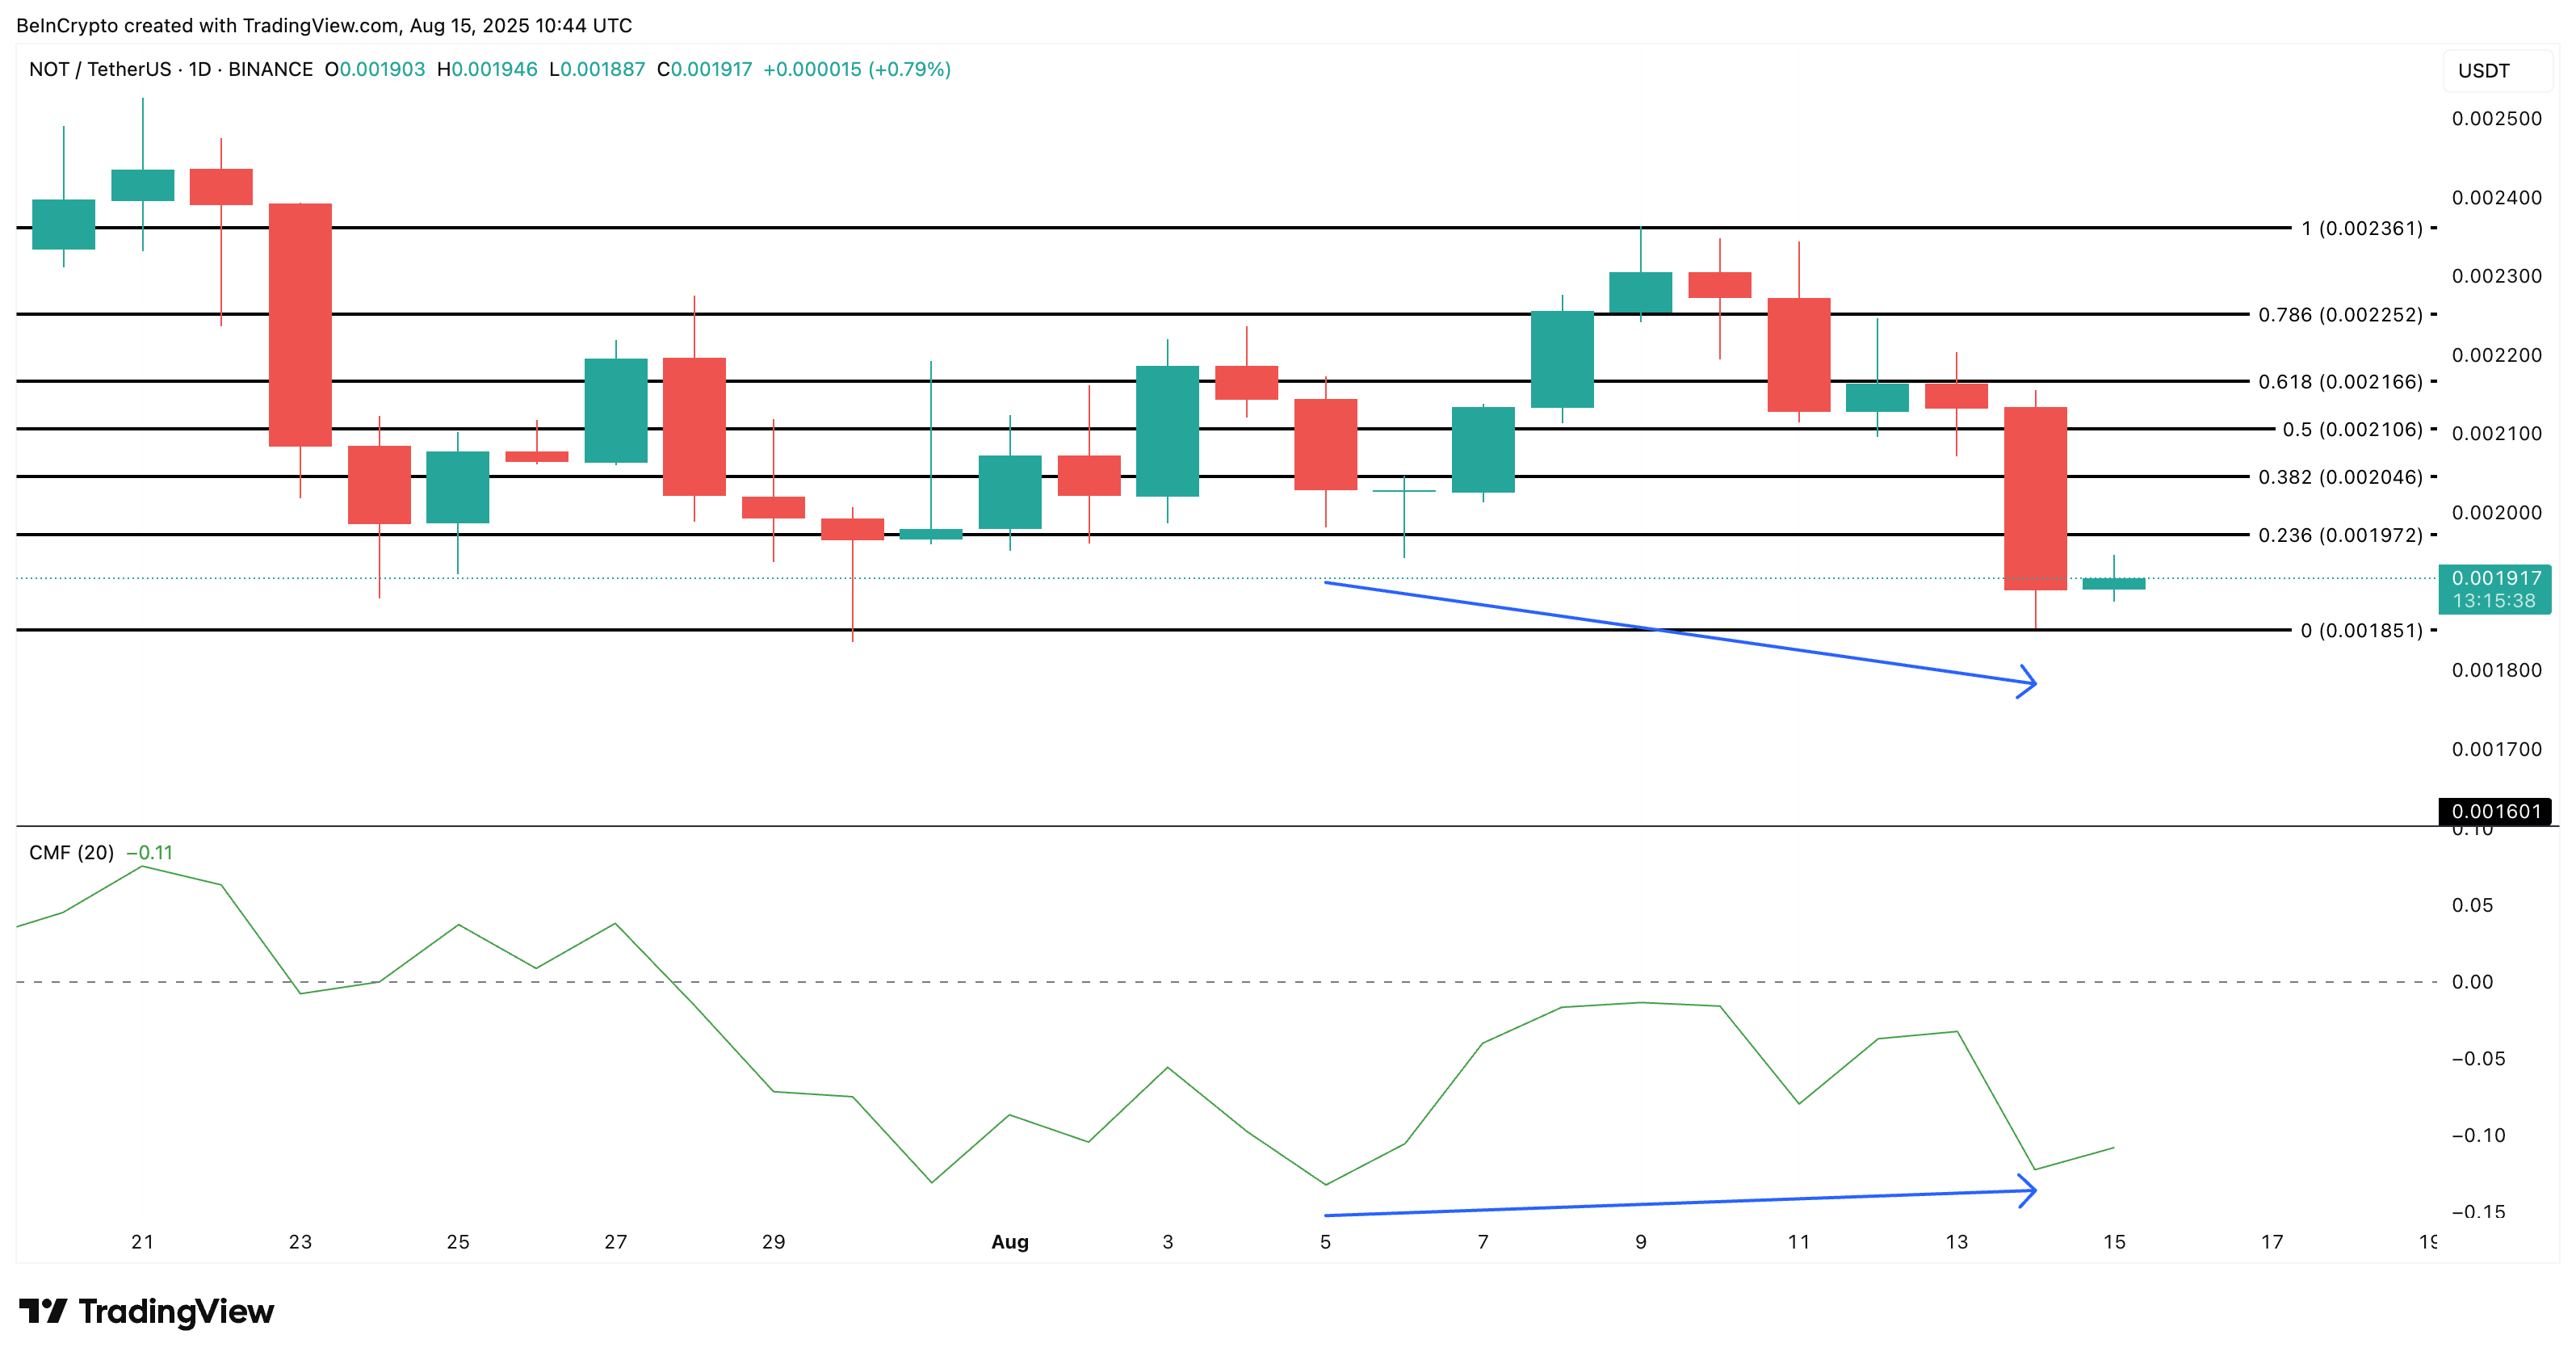
However, the CMF remains in negative territory, indicating the market is still under net selling pressure. For this divergence to become significant, the CMF needs to cross above 0, supported by increased accumulation from the top 100 addresses and a shift to net exchange outflows.
The Chaikin Money Flow (CMF) uses price and volume to measure buying and selling pressure. A CMF above 0 indicates buying strength, while below 0 indicates selling pressure.
If this alignment occurs, a rebound to $0.0019-$0.0020 becomes possible. However, until then, a drop below $0.0018 is more likely, with the risk of a new all-time low still existing. If that happens, the Notcoin price could retest or go lower than the $0.0016 all-time low.