Ethereum has risen by almost 3% in the past 24 hours, and its weekly loss has been reduced to 3.5%. As the price approaches the psychological $4,000 level again, both technical and on-chain indicators suggest that a breakthrough is not far away.
Particularly, three signals are well-connected.
Short-term Holders Accumulating Again
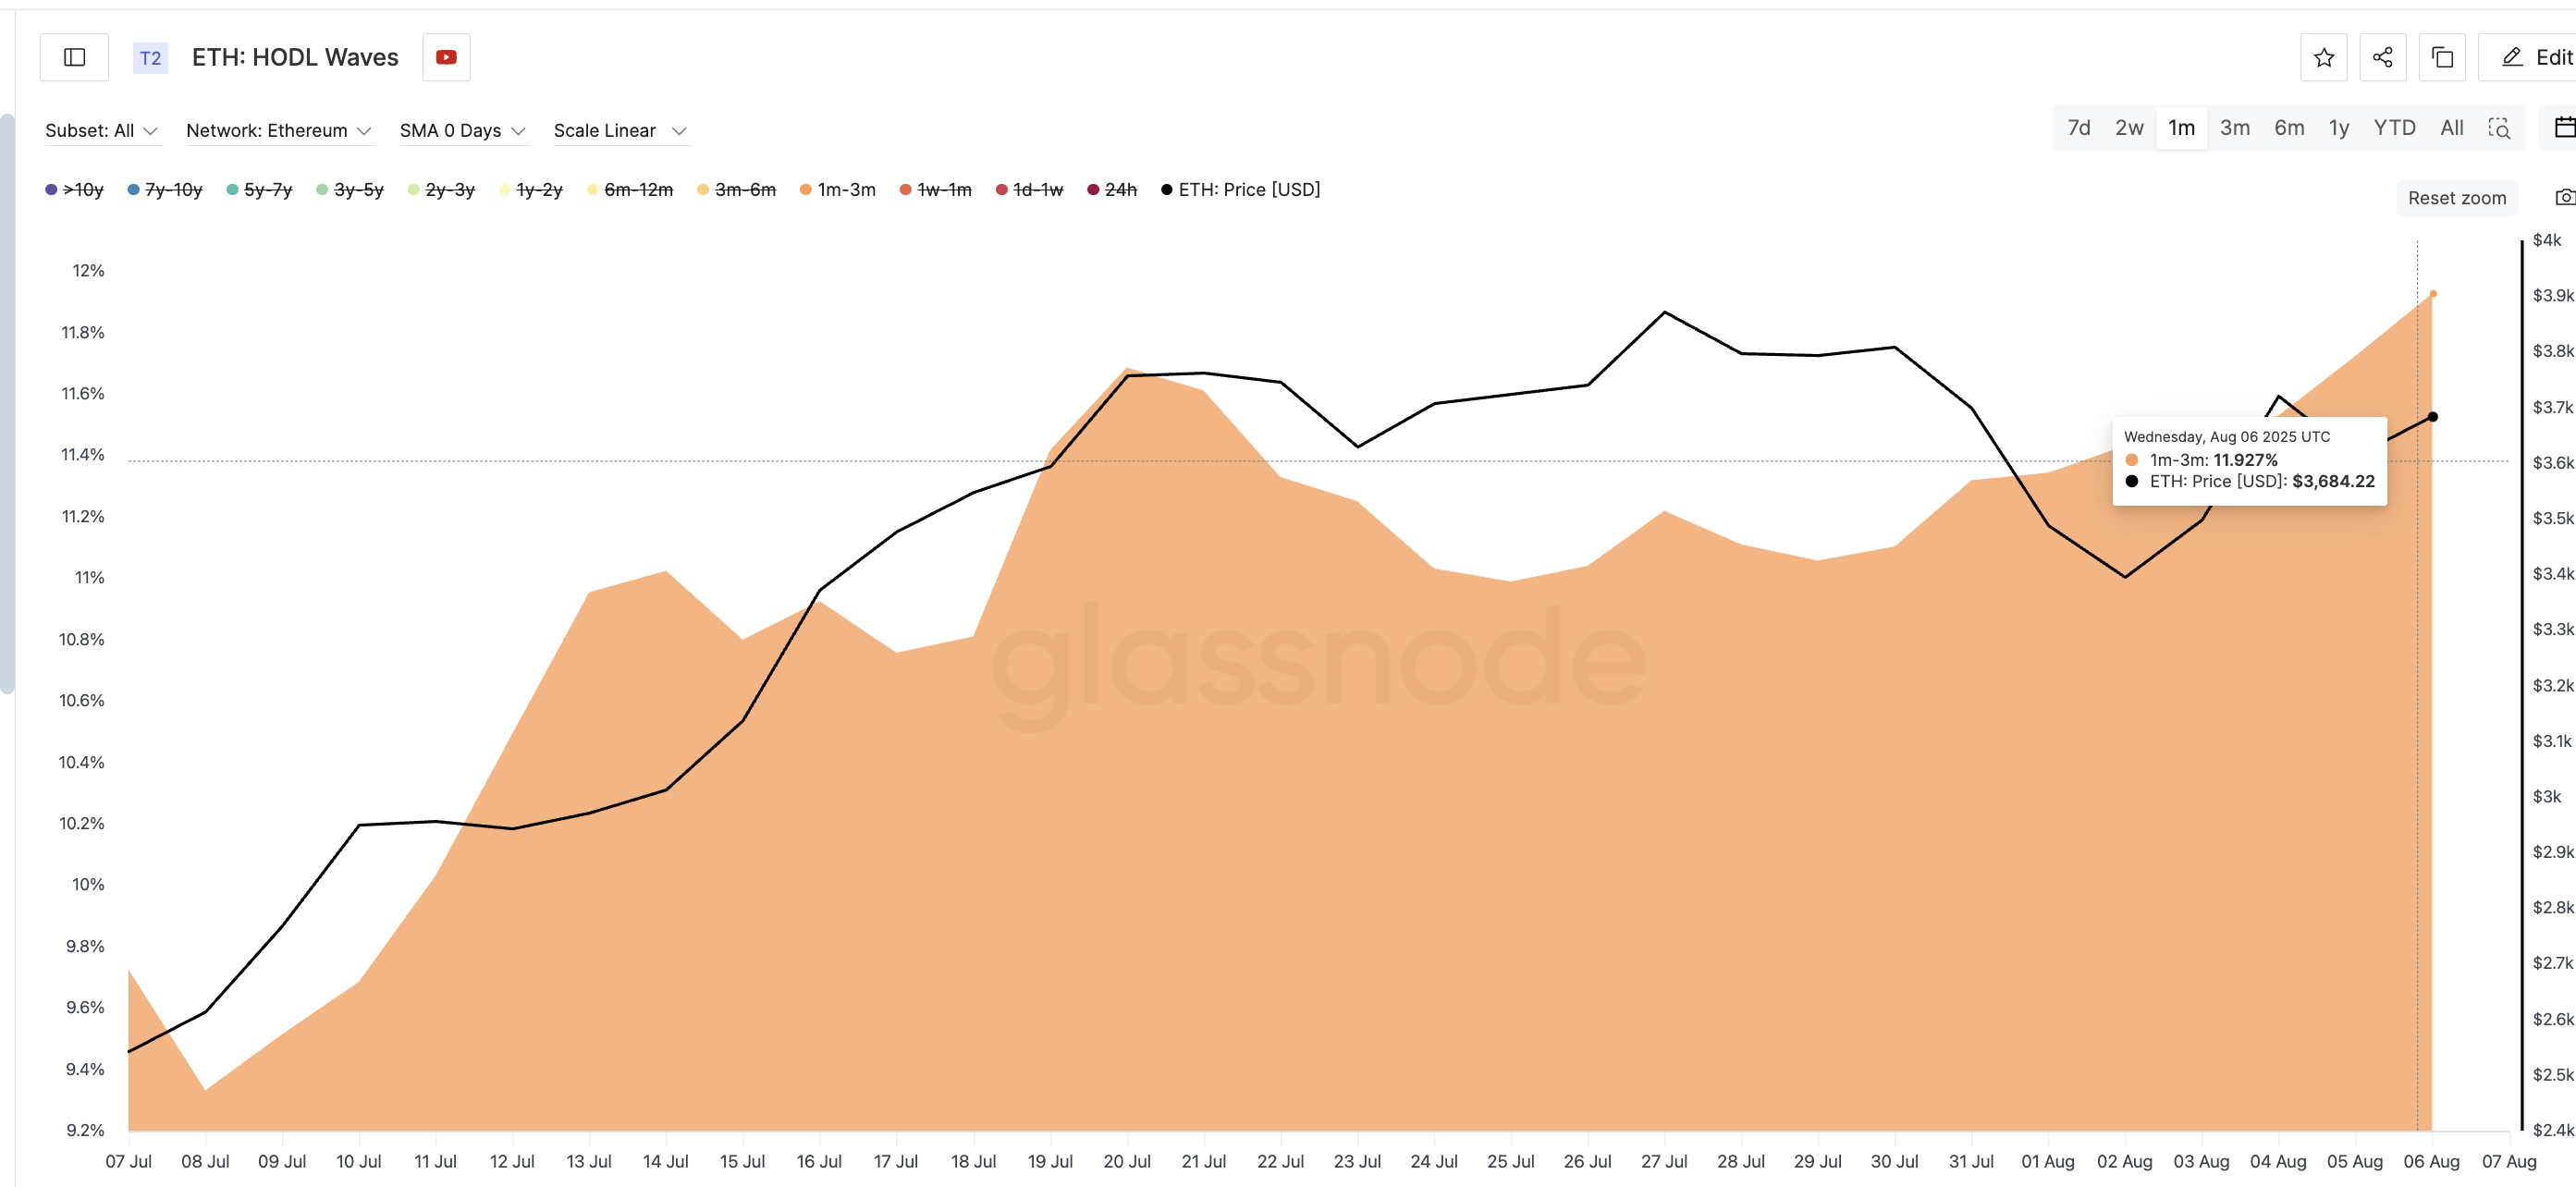
A reliable way to measure upcoming momentum is to track the wallet activity of short-term holders. These are addresses holding Ethereum for 1 to 3 months, often associated with new accumulation. According to HODL wave data, the percentage of these addresses has sharply increased from 9.57% to 11.93% in a month, showing that buying activity has resumed.
Token TA and Market Update: Want more such token insights? Subscribe to the daily crypto newsletter by editor Harsh Notariya here.
These holders often enter when bottoming out and start the breakthrough.
HODL Waves show the percentage of Ethereum supply held for various periods. The 1-3 month group is particularly important in identifying accumulation during transition stages.
SOPR Suggests Weakening Selling Pressure
Supporting this buying activity is the behavior of the SOPR indicator, or Spent Output Profit Ratio, which tracks whether coins being sold are in a profit state. As SOPR declines while the price stabilizes or rises, this often indicates a slowdown in profit-taking.
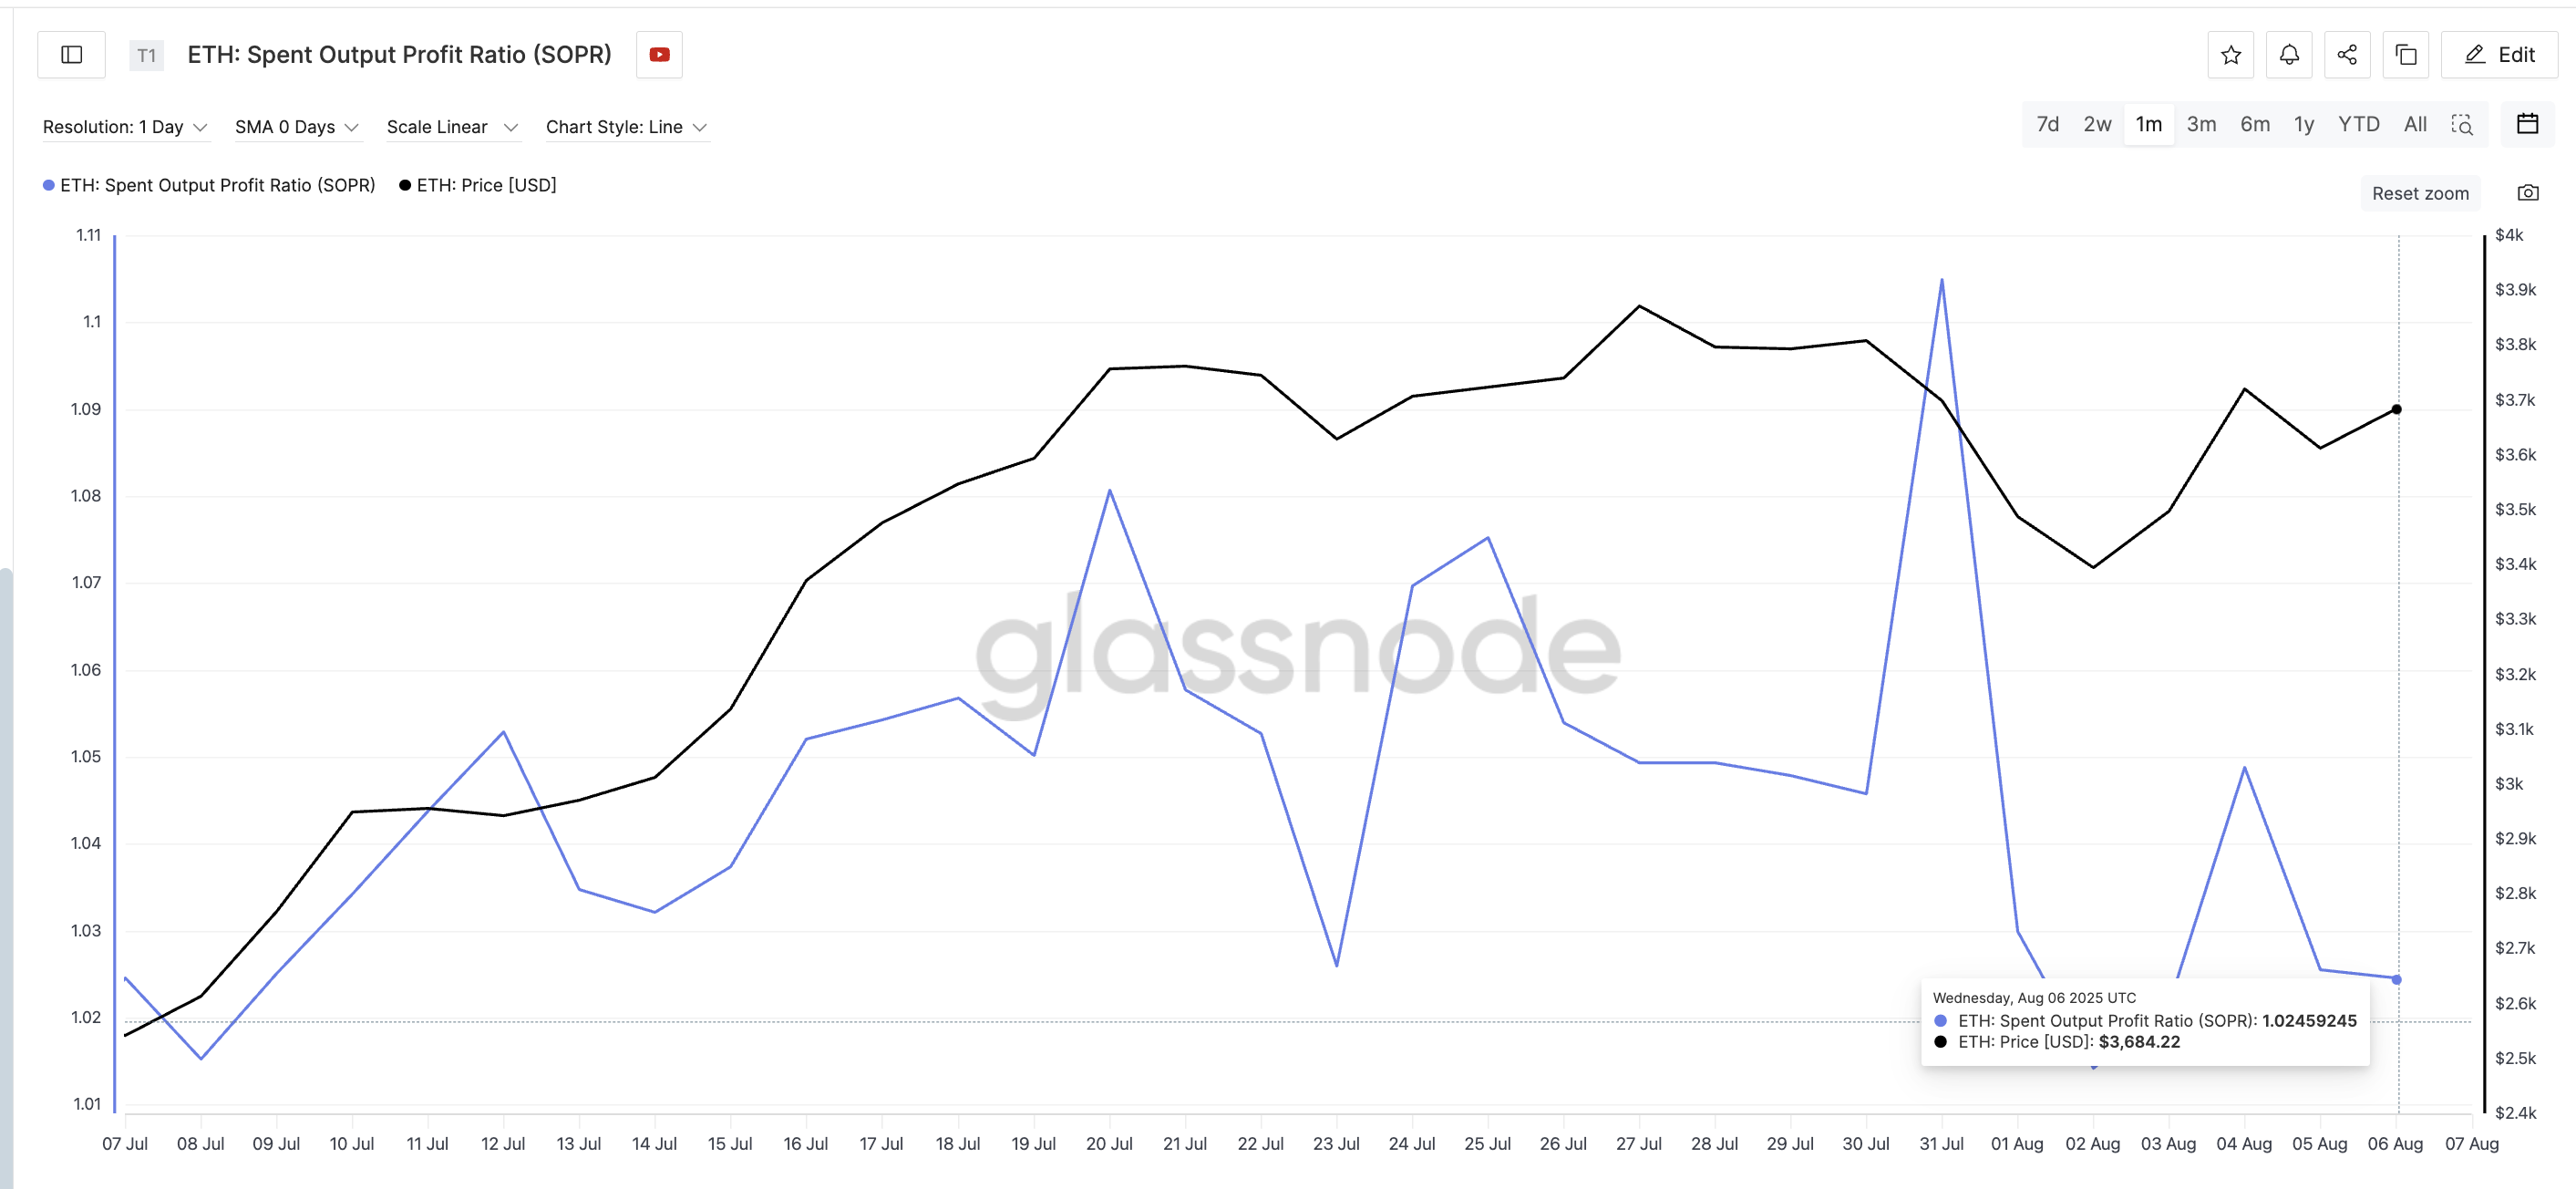
This is happening right now. SOPR has declined, but Ethereum's price has slightly increased. The last time this occurred, ETH soon gained momentum in late July. This is a typical bottom-forming pattern. If this behavior continues, it adds strength to the idea that $4,000 could be reached.
SOPR helps measure market confidence. When sellers do not realize profits despite price increases, it suggests growing confidence in further rises.
Weakening Resistance, Buyer Inflow... Positive for Ethereum Price?
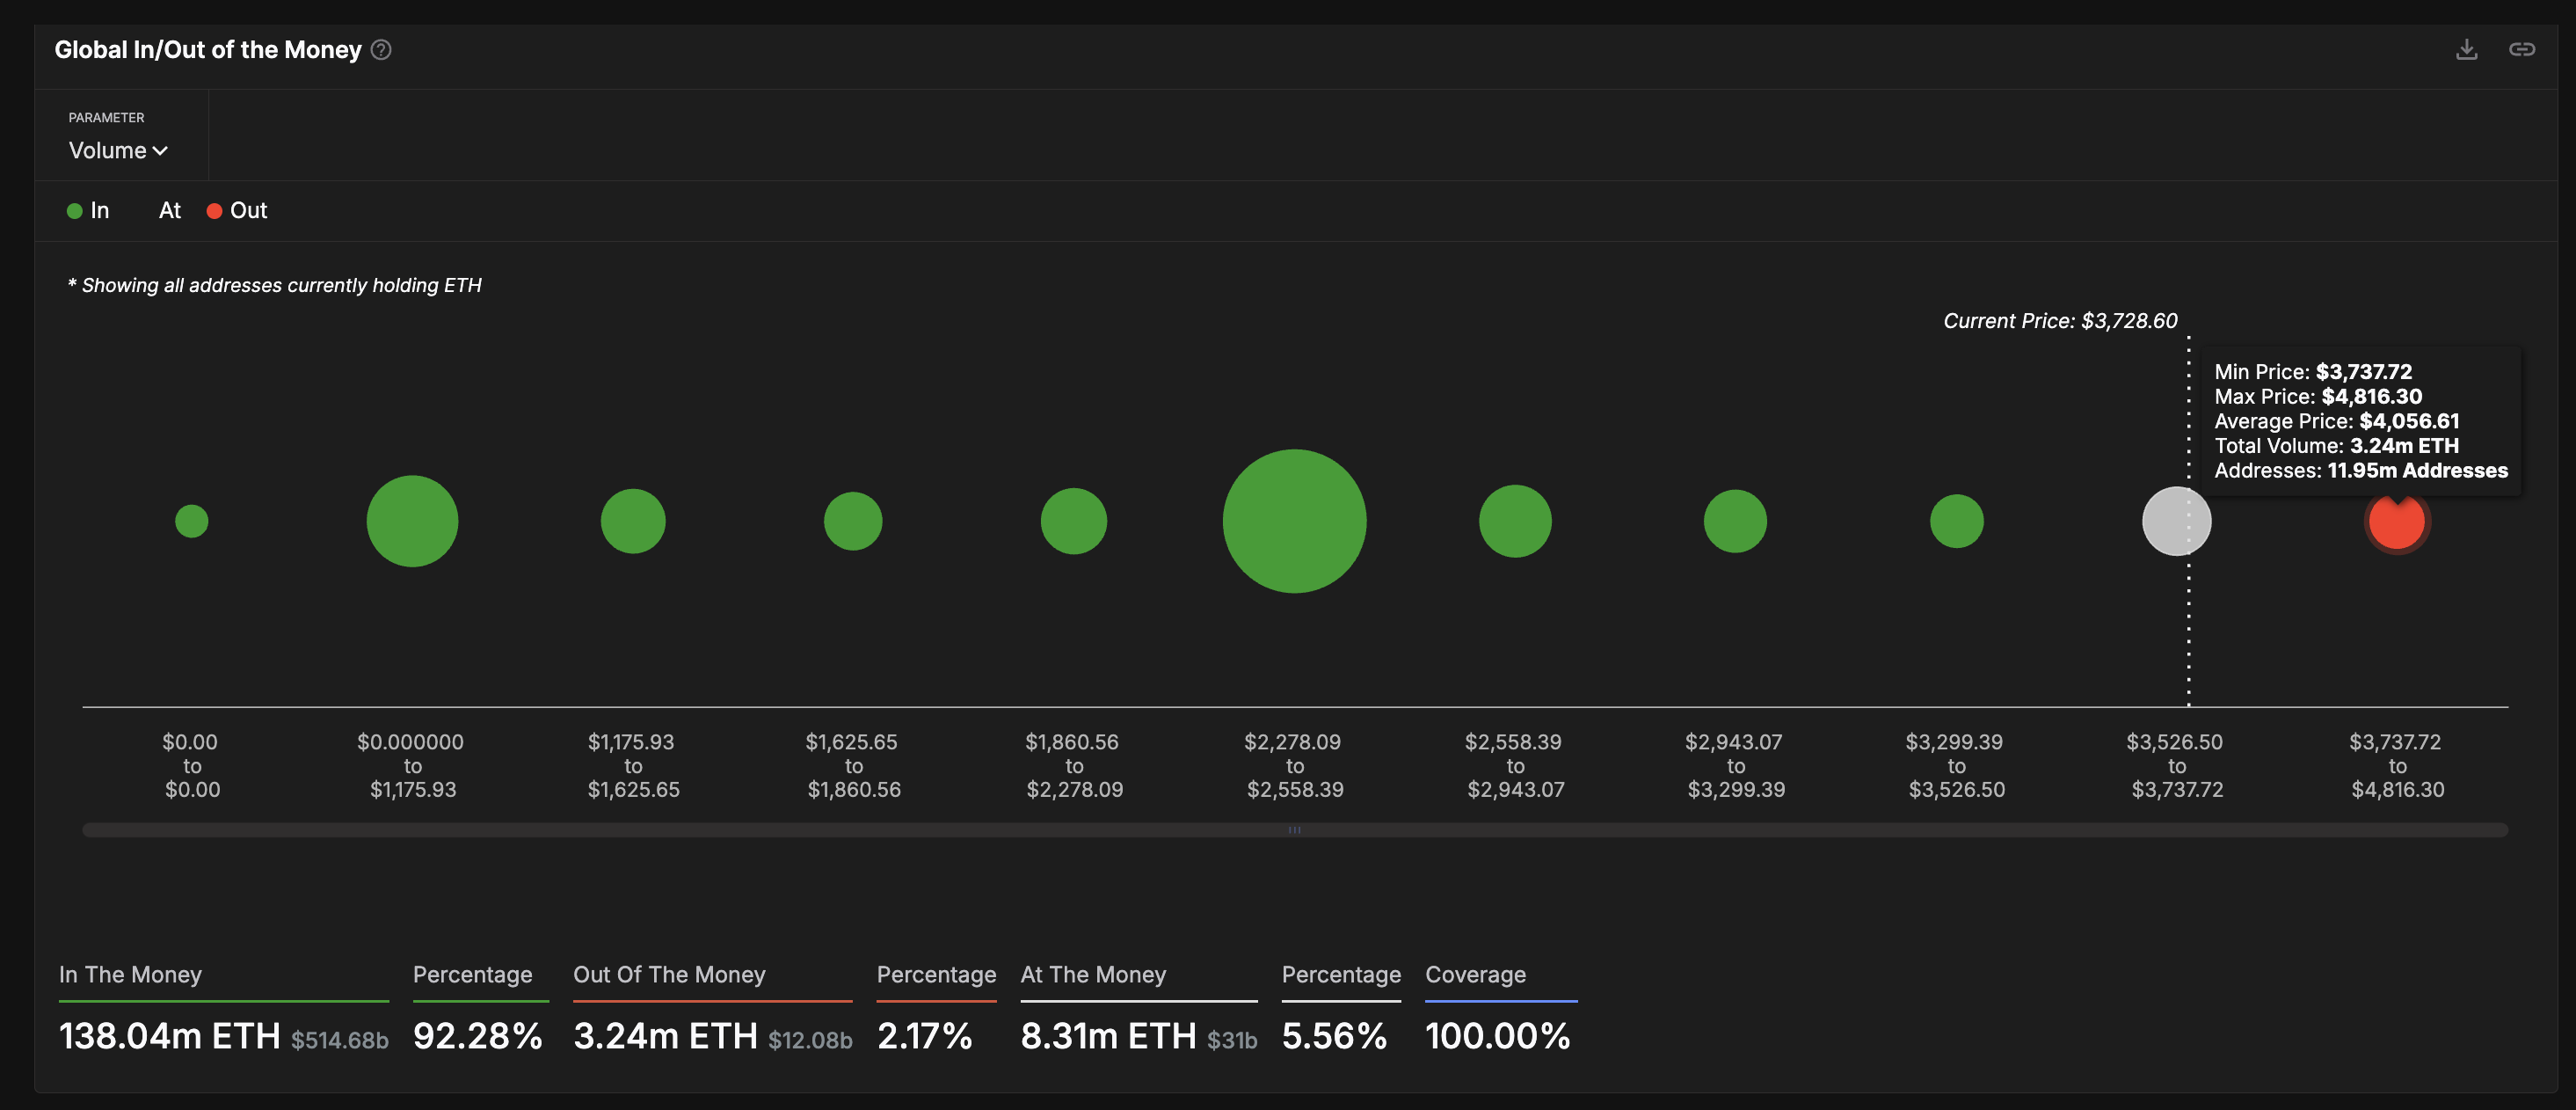
According to on-chain data from IntoTheBlock's Global In/Out of the Money model, the current resistance zone is weak. Only 11.95 million addresses are just above Ethereum's current price of $3,720. This suggests a lower probability of strong resistance up to the $3,937 level, as fewer holders are positioned to sell at their break-even points.
This $3,937 level is important according to the weekly price chart. In past cycles, Ethereum was rejected near $4,100, twice in March 2024 and December 2024. However, this time, the ETH price has not yet tested $4,000, despite maintaining above $3,300 since June. This means the retest of the $4,000 mark has been long delayed.
Note: Weekly charts are used to remove range-bound movements. ETH has been trapped for some time.
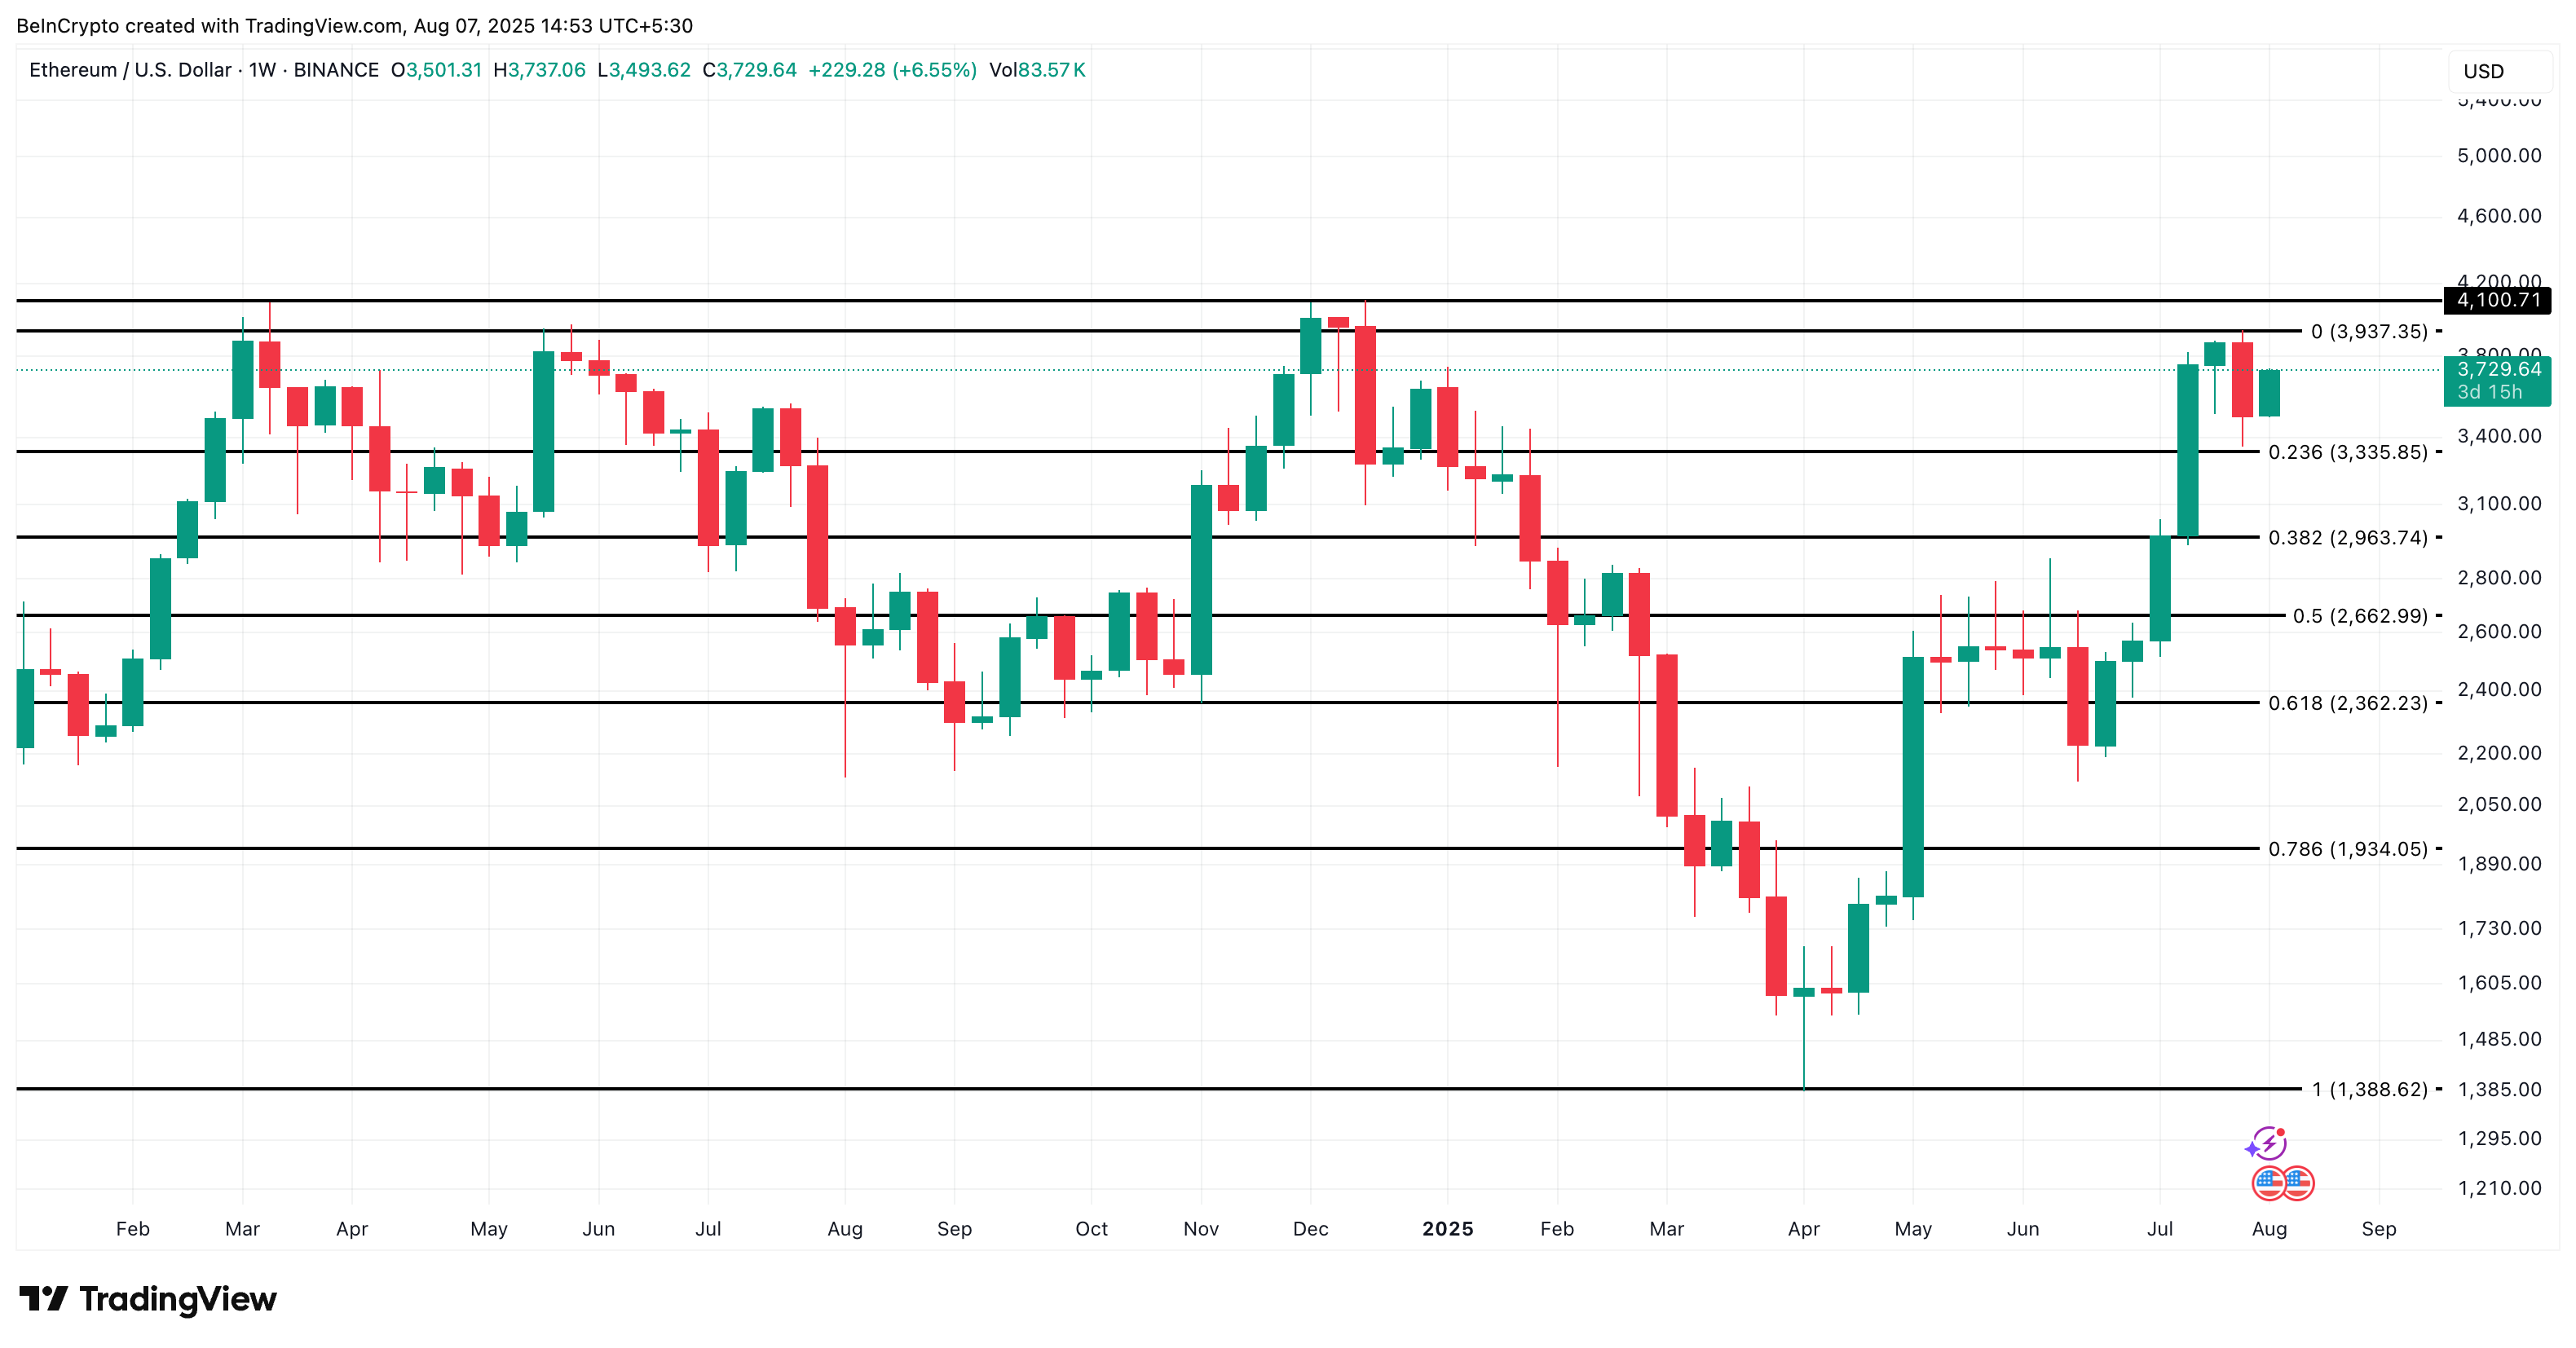
If Ethereum definitively crosses $3,937, the lack of selling pressure makes a rally above $4,000 increasingly possible. However, if SOPR declines with price correction or short-term buyers turn into sellers, $3,335 will become a notable critical level.
A breach below that, especially on larger time frames, could invalidate the current hypothesis by shifting the structure to bearish.