Stellar (XLM) price has surged over 16% in the past 24 hours, breaking through the bullish continuation pattern. While many traders might anticipate a correction, several technical indicators suggest this could be the start of a much larger rally.
However, one on-chain indicator is sending a signal that requires attention.
Triple EMA Crossover Shows Strong Uptrend
The 4-hour chart clearly shows trend momentum, with the triple EMA crossover beginning to show strength. The 20-period exponential moving average (EMA) has already broken above the 50 and 100 EMAs, and the 50 EMA is now preparing to break above the 100 EMA.
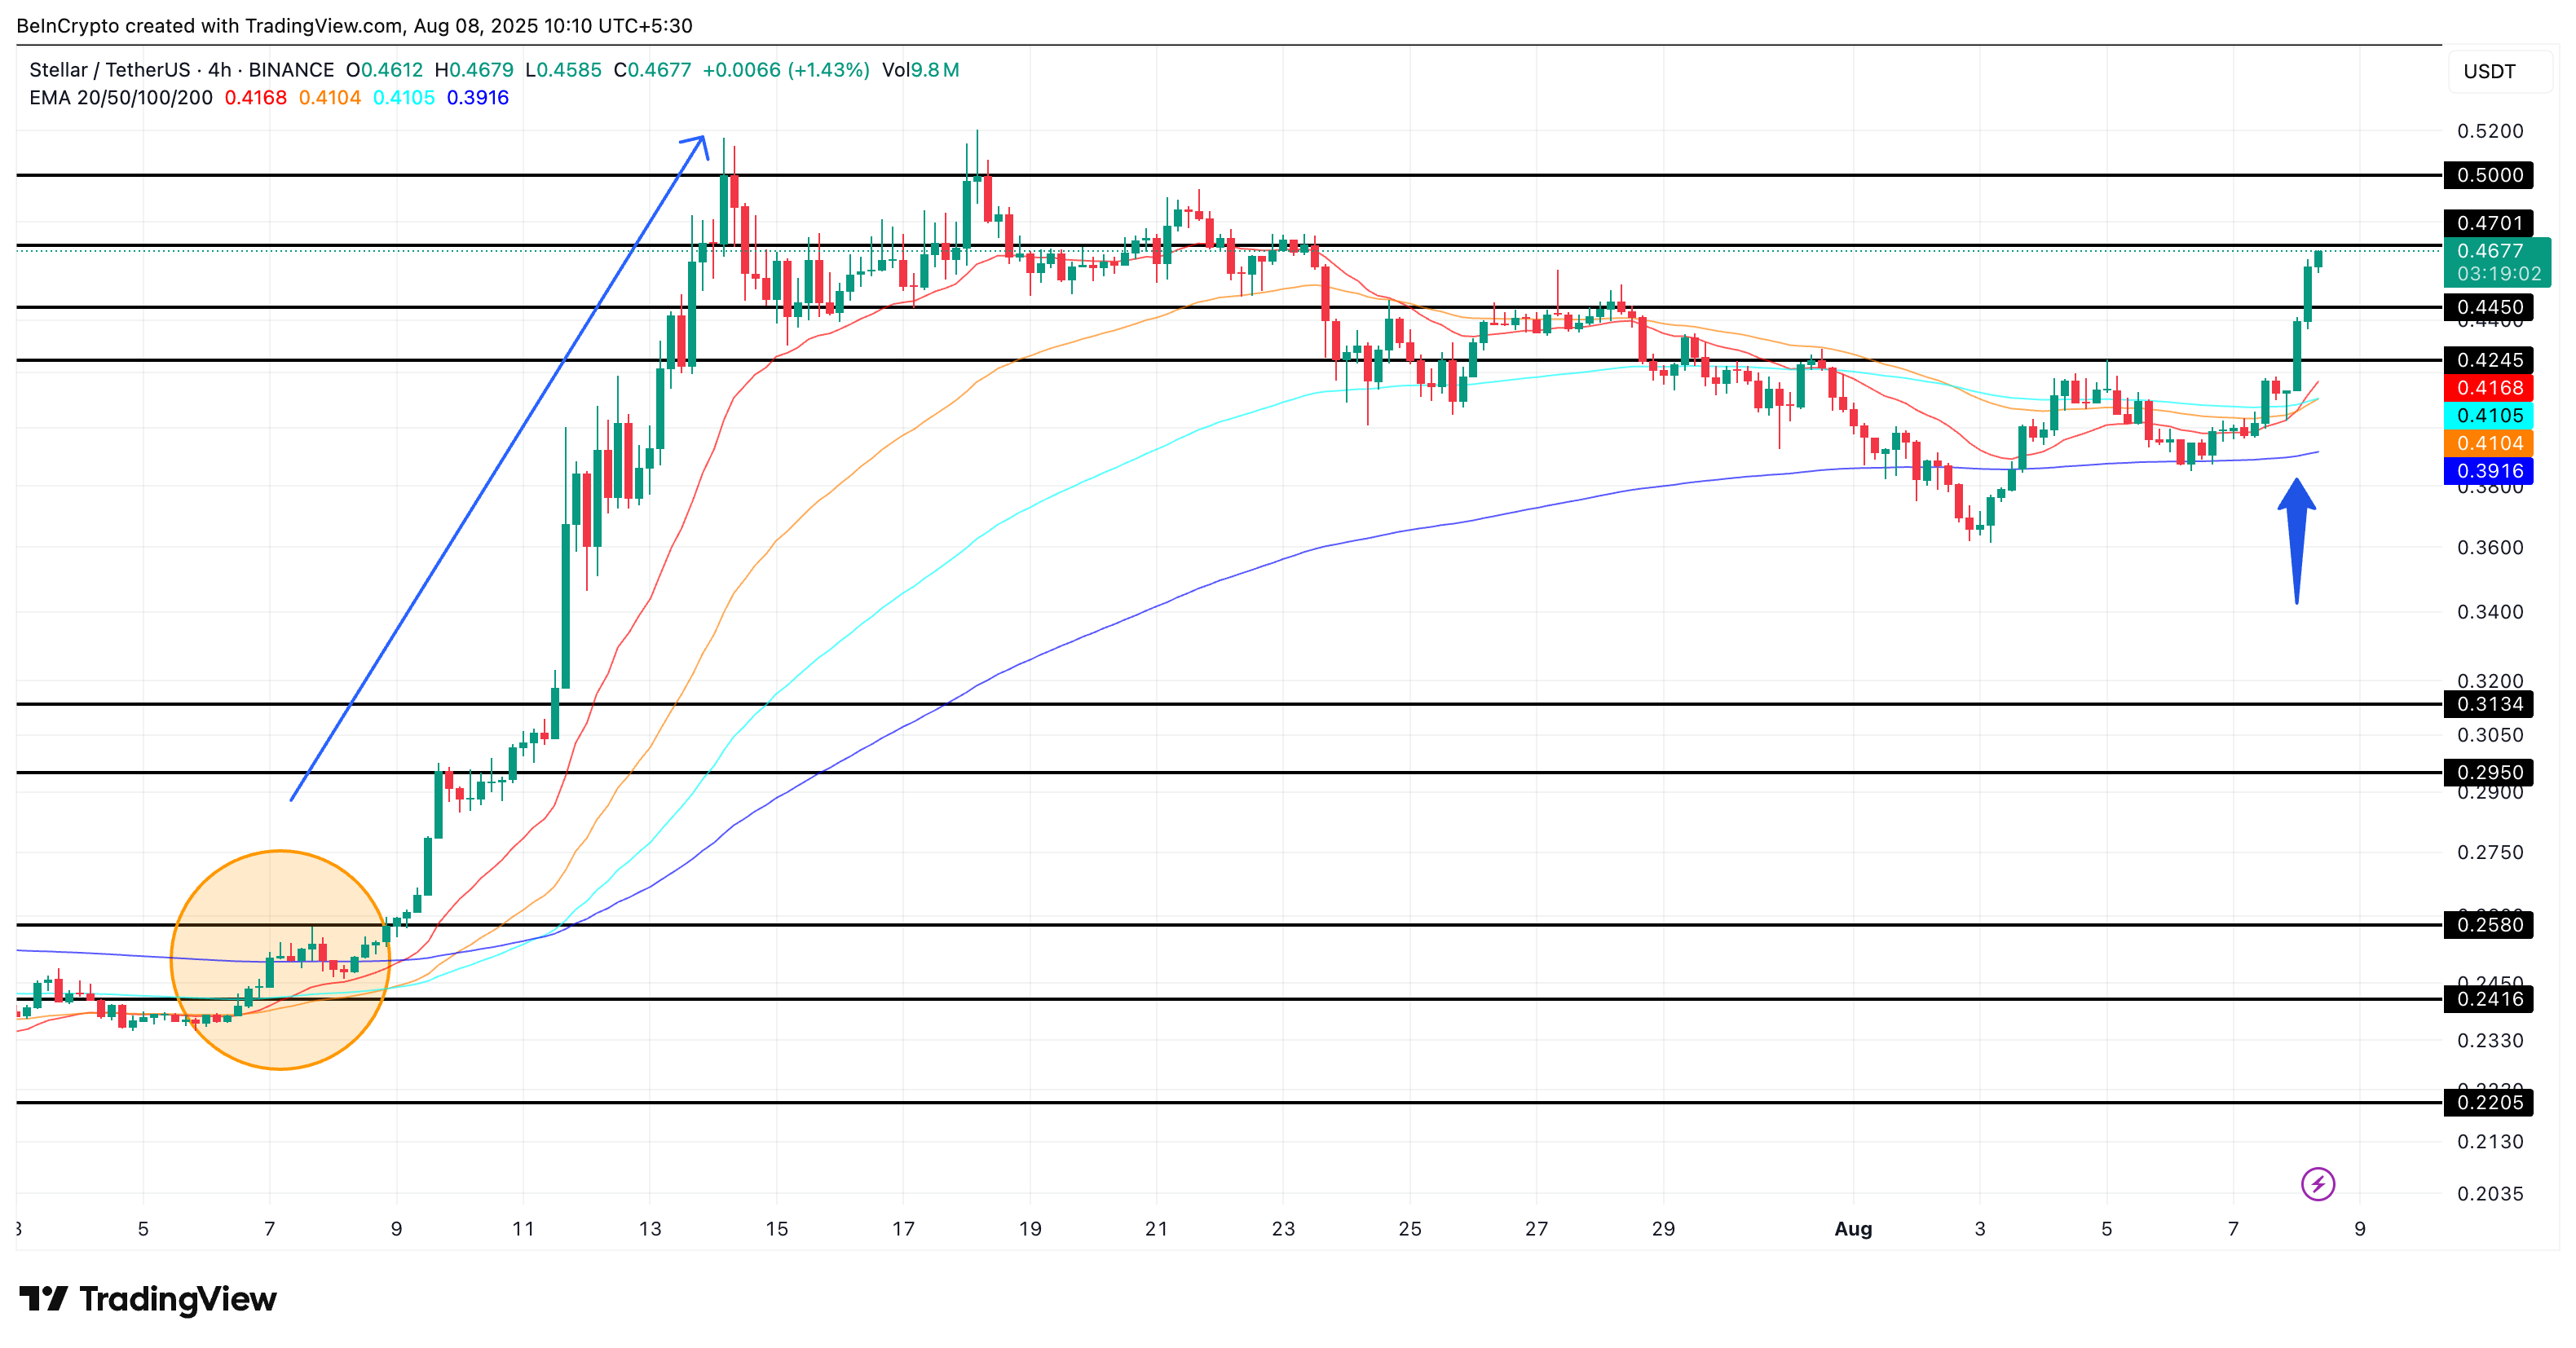
The exponential moving average (EMA) is a technical tool that smooths price data, giving more weight to recent prices. It reacts more quickly to recent movements than a simple moving average (SMA). A "golden cross" occurs when a short EMA crosses above a long EMA, which traders often use to confirm a bullish trend reversal.
Historically, the last time this triple crossover setup occurred was in early July, when the Stellar price jumped from $0.23 to over $0.52, recording an approximately 122% increase. With the current price rising above $0.46, a strong technical momentum is forming, with $0.50 being an immediate psychological resistance and the $0.52–$0.90 range being an expansion zone for bullishness.
Token TA and Market Update: Want more such token insights? Subscribe to editor Harsh Notariya's daily crypto newsletter here.
Net Inflows, Early Profit-Taking Risk
The spot exchange net inflow chart shows an increase from $724,000 last week to $9.12 million this week, an increase of over 1,159%. This indicator tracks how much XLM is flowing in or out of exchanges. Increased inflows typically suggest traders are moving tokens to exchanges to potentially sell.
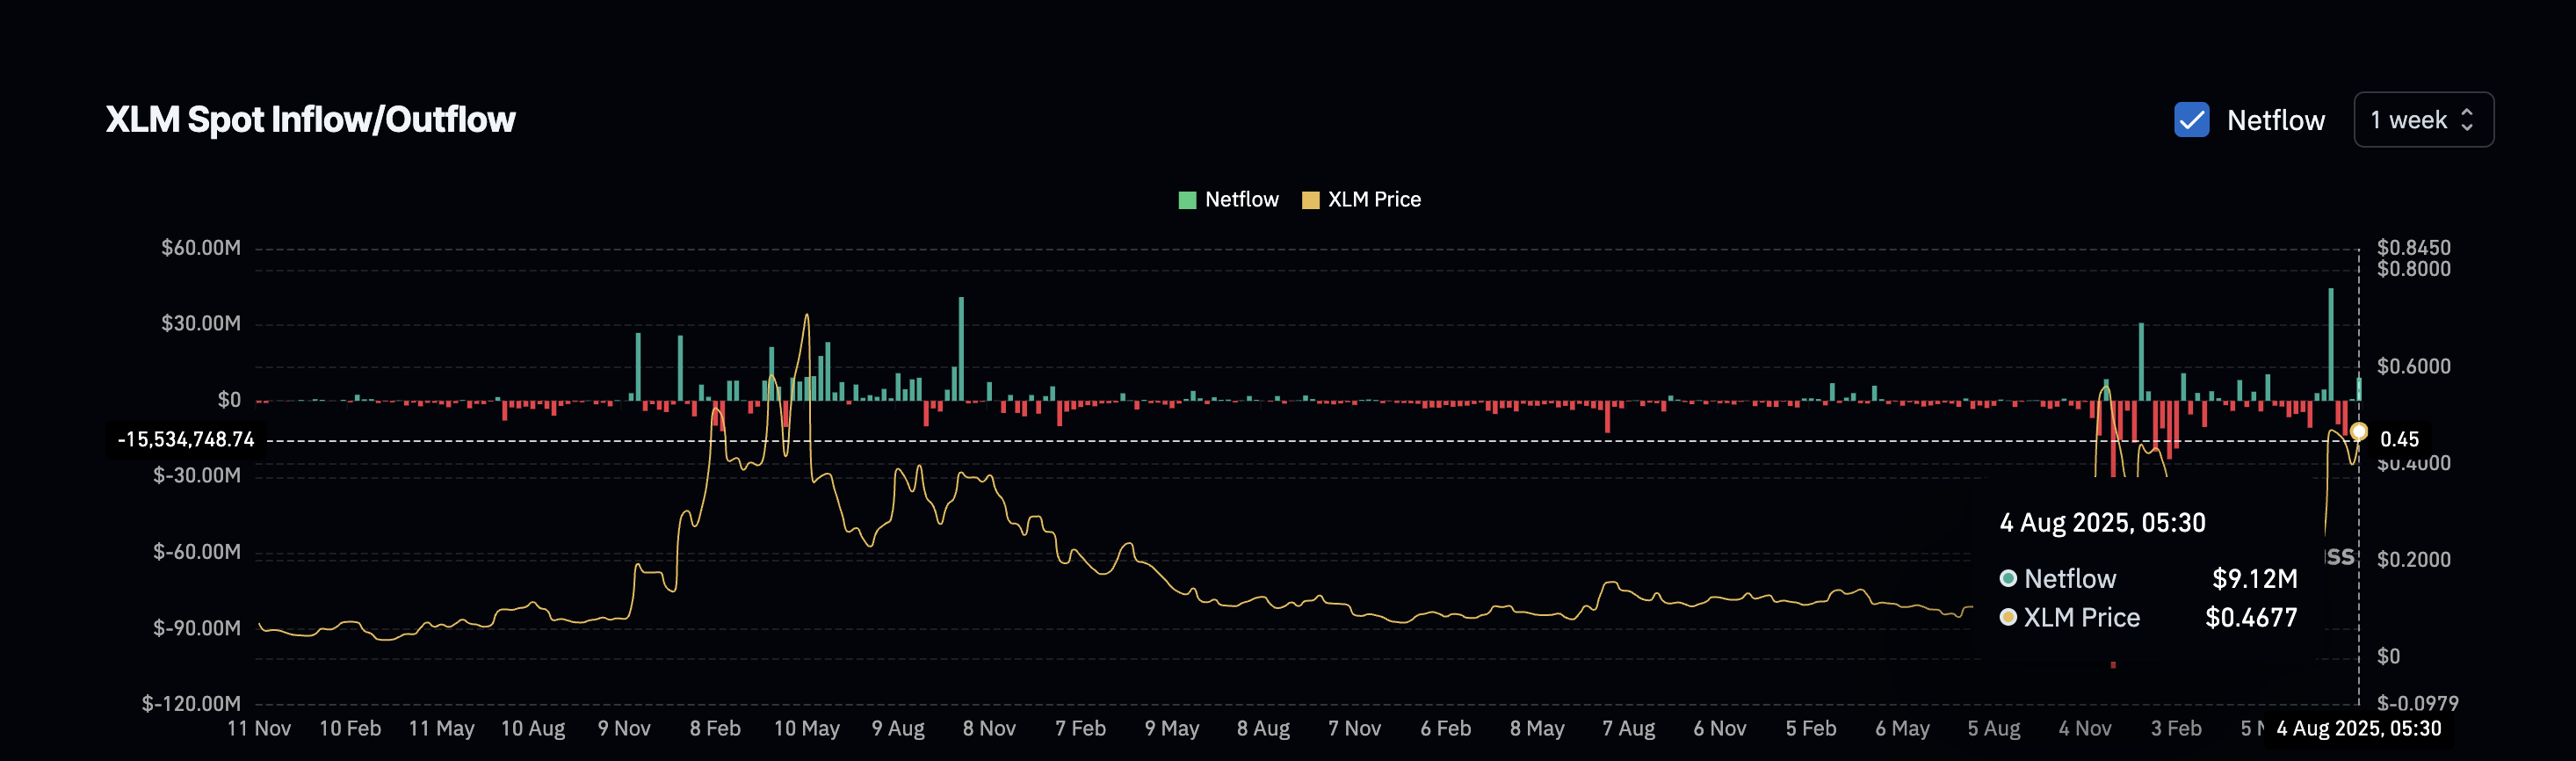
This is not unprecedented. On June 23, 2024, net inflows turned positive, and the Stellar price soon dropped from $0.26 to $0.24. Another instance was on December 30, 2024, when exchange inflows surged after weeks of silence, causing a short-term price correction.
Therefore, while the technical setup looks bullish, traders should be cautious of potential corrections due to profit-taking pressure in the upcoming session.
Bull-Bear Power Index Confirms Stellar Price Breakout
The daily chart's flag and pole breakout further strengthens the bullish claim. This begins with a strong price increase (pole) followed by a slanted consolidation (flag), and the breakout typically leads to another rise.
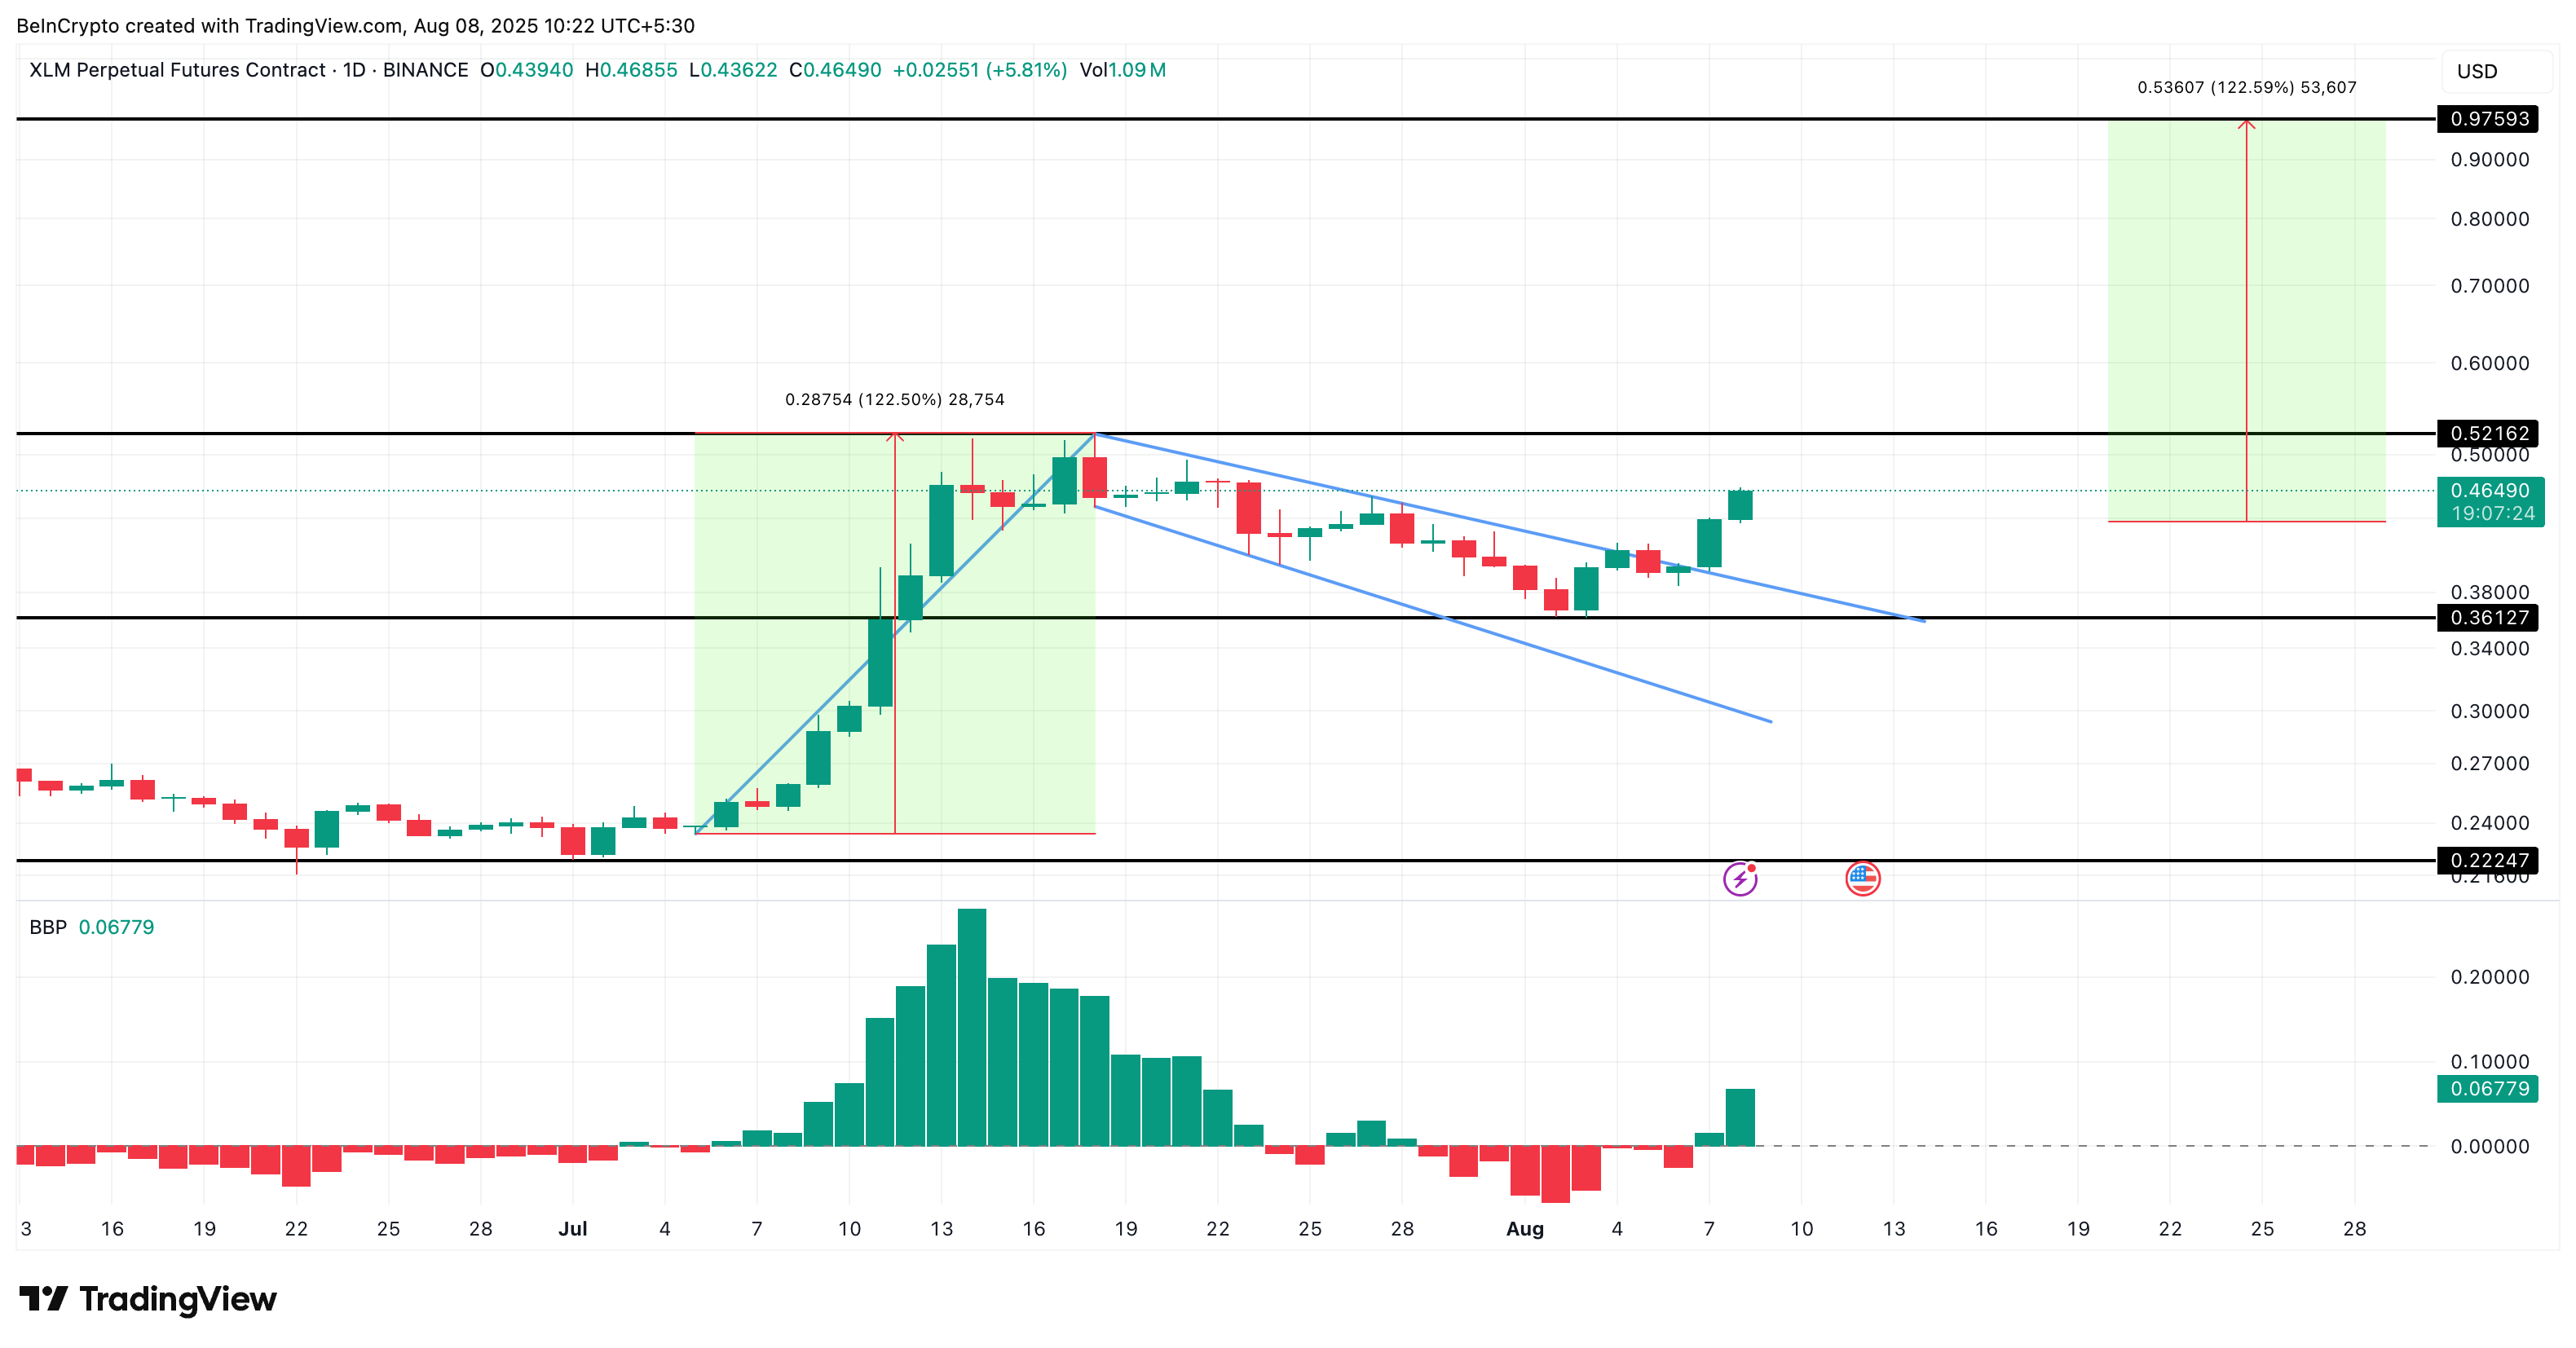
What makes this case even more powerful is the Bull-Bear Power (BBP) index turning green again. This indicator shows the difference between the highest price buyers are willing to pay and the lowest price sellers are willing to accept. A green BBP at breakout usually confirms that buying strength is returning.
The pole is measured from the $0.23 bottom to the $0.52 top, and if the same extension is applied from the breakout candle's close, the next Stellar price target would be near $0.97, assuming the rally continues. Notably, the pole includes the same XLM price rally zone previously concluded as part of the triple crossover. To form a clean upward movement, Stellar price must first break above $0.52, which is the previous swing high or the pole's peak.
However, the short-term bullish hypothesis becomes invalidated if the Stellar price falls below $0.36, primarily driven by the increased selling pressure previously emphasized.