When Bitcoin reaches a new all-time high, risk warnings begin to appear. However, experts and analysts highlight three positive Bitcoin indicators that emerged in August.
These indicators act as rare signals, suggesting that the Bitcoin season may have started this month, even after the price exceeded $120,000.
1. Bitcoin Futures vs Spot Ratio
The first is the futures to spot ratio, which has fallen to its lowest level since October 2022. Why is this important?
According to SwissBlock, this ratio compares futures trading Volume to spot trading Volume. A low ratio indicates that large investors are actively buying BTC in the spot market instead of futures.
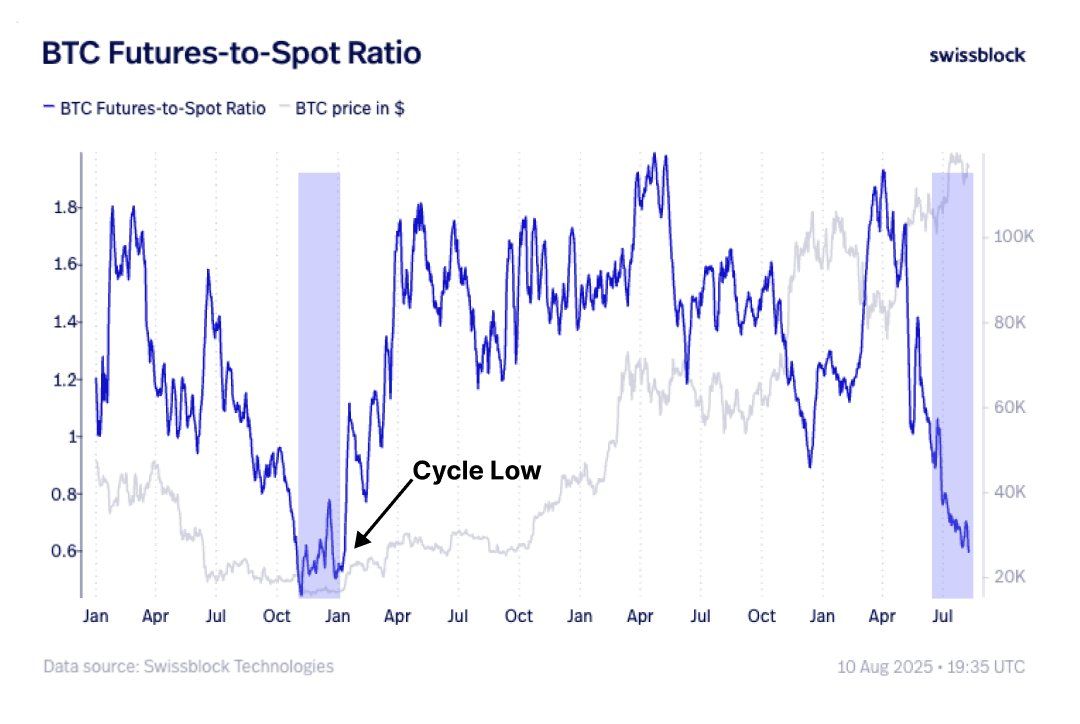
"Since the April low, this movement has been driven by spot. Large investors are buying all BTC. The futures to spot ratio has returned to the October 2022 low. This is a signal of massive spot demand." – SwissBlock report.
Historically, when this ratio drops sharply, it often indicates the bottom of a cycle. This is similar to before BTC exceeded $100,000 at the end of 2022. This suggests that despite Bitcoin already reaching six figures, the rally may still be in its early stages.
"Target of $120,500 has been achieved. What now? Price momentum is aligning. Yes, macro volatility is expected and downward pressure may occur, but as momentum ignites, we move higher." – SwissBlock prediction.
2. CEX Volume Ratio, Bitcoin vs Altcoins
The second indicator is the spot trading Volume ratio between Bitcoin and altcoins.
This ratio compares the spot trading Volume of BTC on centralized exchanges (CEX) with altcoins. A rising ratio shows that Bitcoin is attracting more capital, which is a typical signal of a "Bitcoin season".
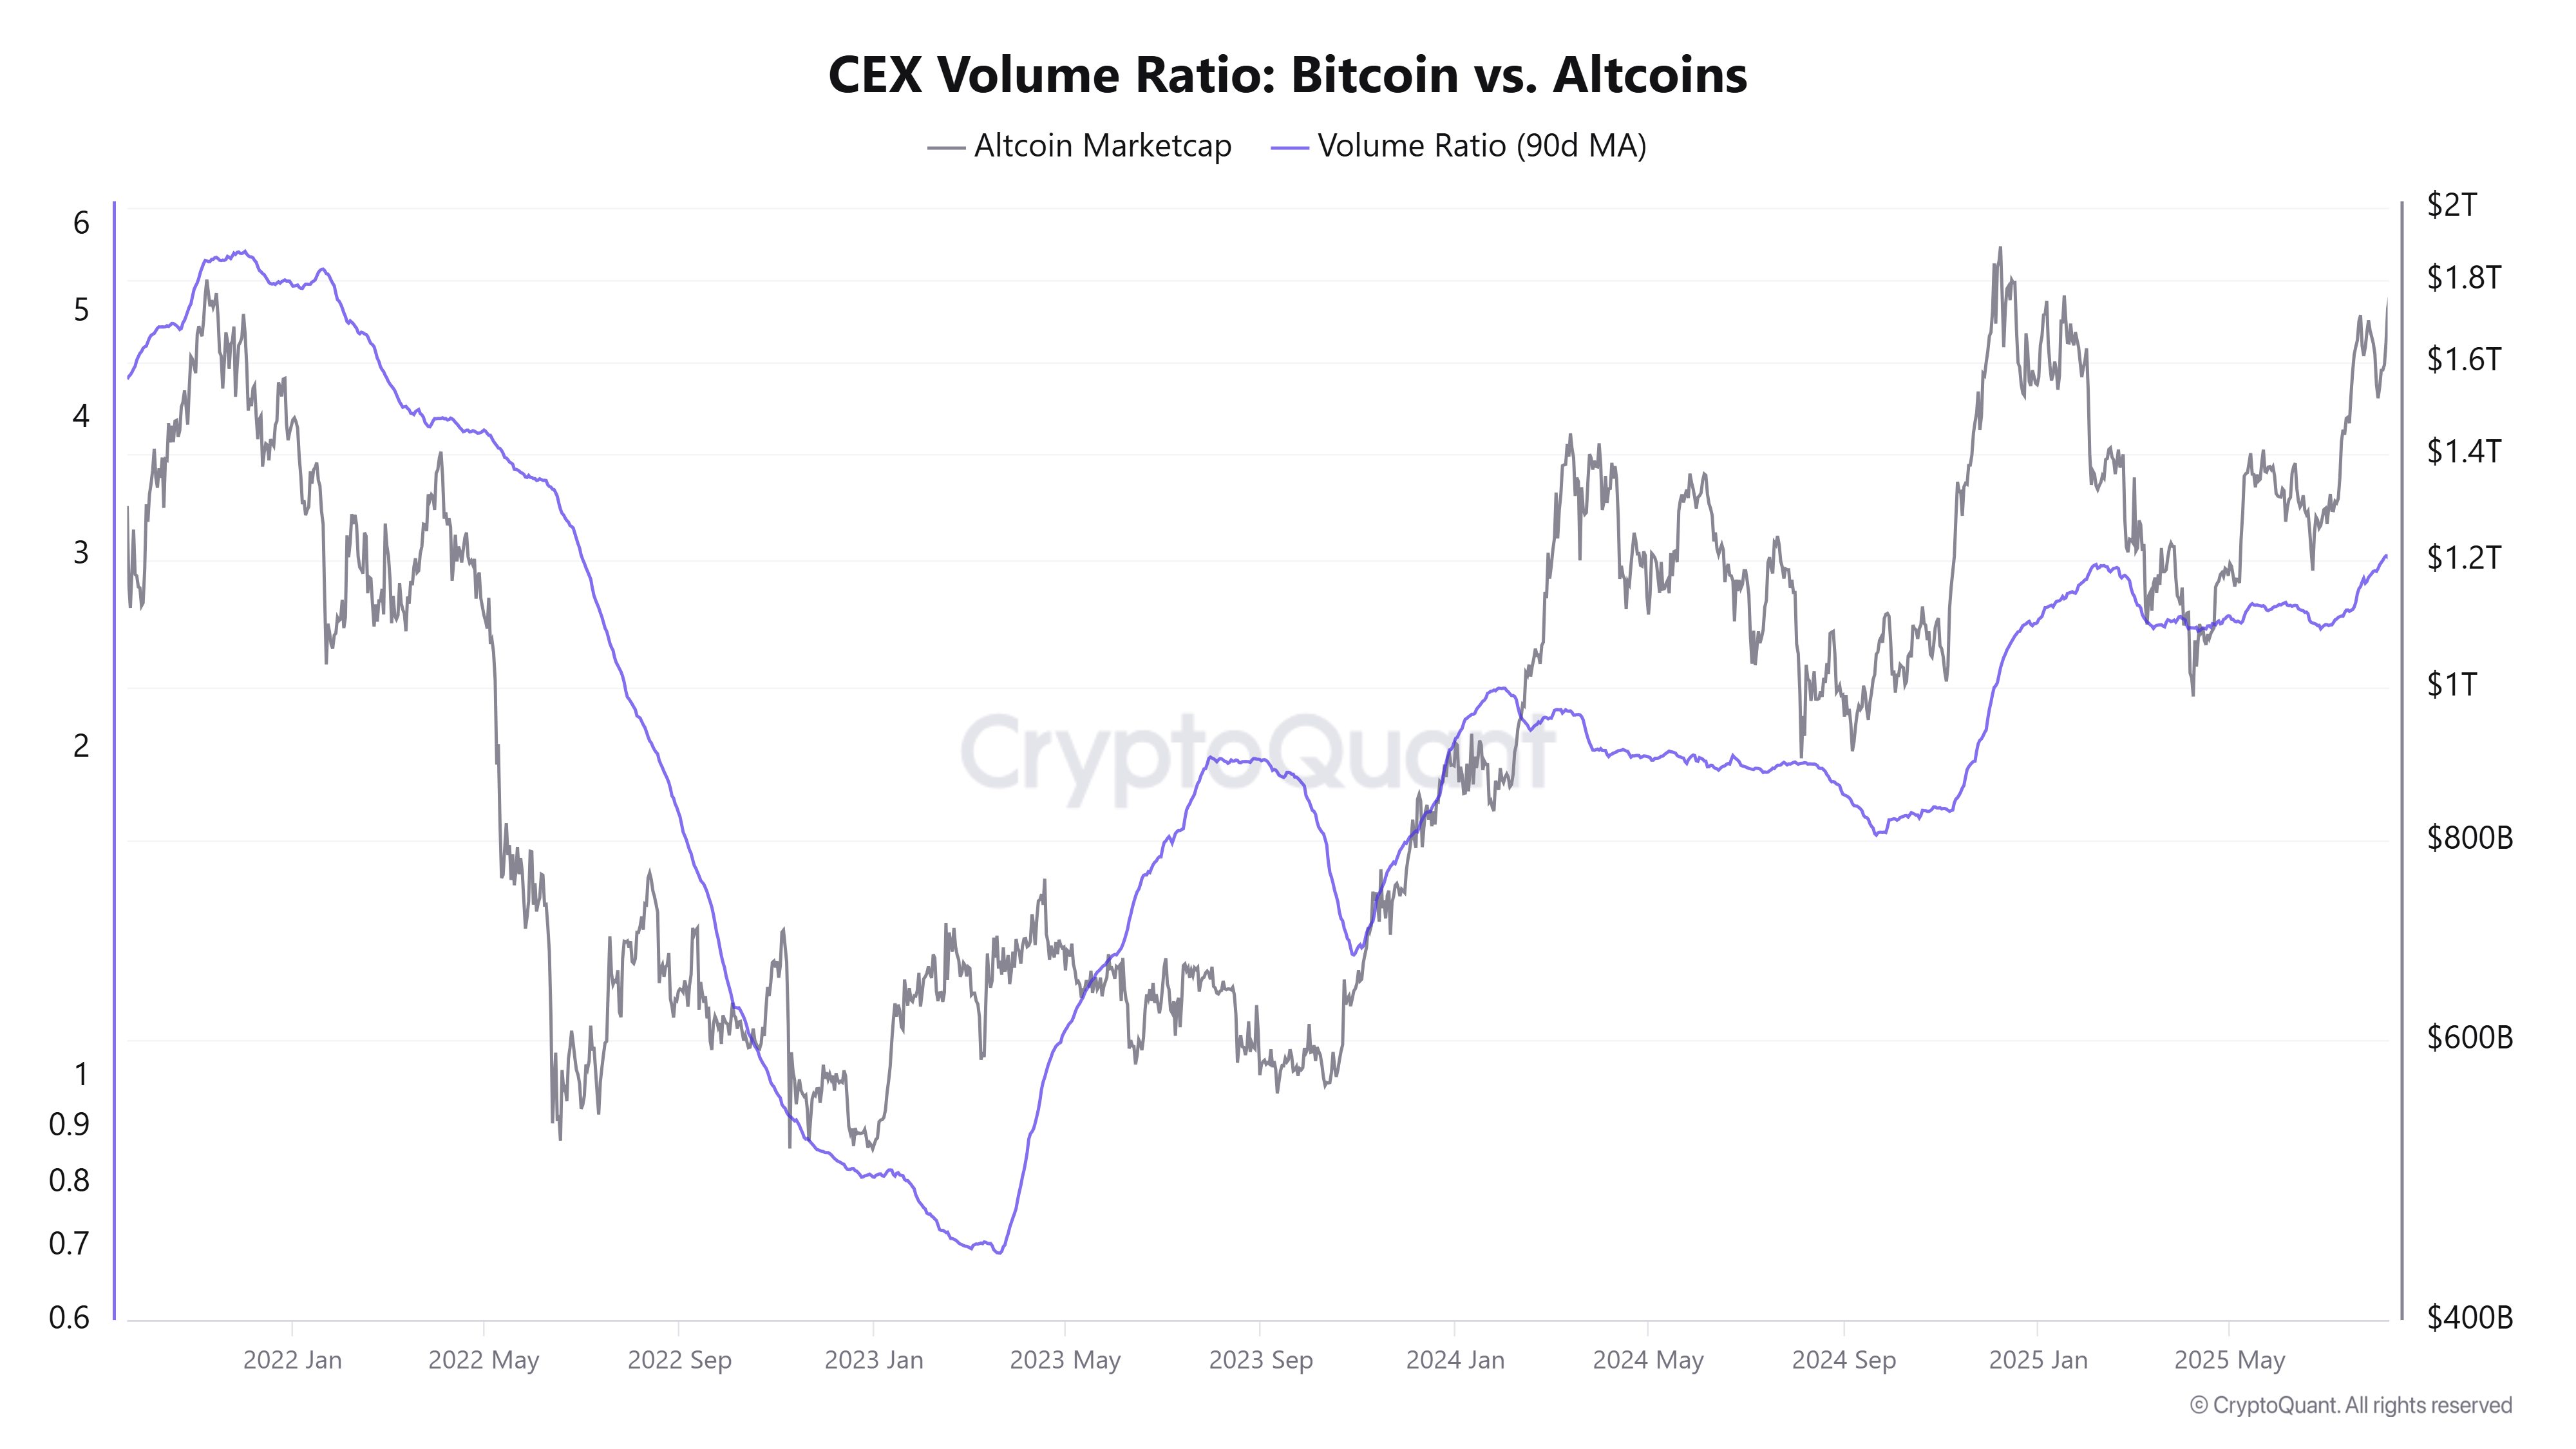
According to CryptoQuant data, this ratio tends to rise with Bitcoin's price. In August 2025, it rebounded to 3, the highest since July 2022. This means Bitcoin's trading Volume is three times that of all altcoins.
Historically, when this ratio exceeds 3 and moves towards 5 (as in late 2021), BTC often leads a strong market rally. This suggests that the current market situation has not yet reached the full potential of a Bitcoin season.
3. Bitcoin Taker Buy-Sell Ratio
Lastly, the taker buy-sell ratio indicates a strong new buy momentum forming.
According to CryptoQuant analyst CrazyBlock, this ratio divides buy Volume by sell Volume, measured by traders initiating market orders.
"Takers set the immediate mood of the market. When they actively buy, it often precedes an upward movement, and when sells dominate, it can signal downside risk." – CrazyBlock explanation.
A value above 1 indicates an upward trend. CrazyBlock also mentions that when this value exceeds the 7-day average, it signals a new buy momentum.
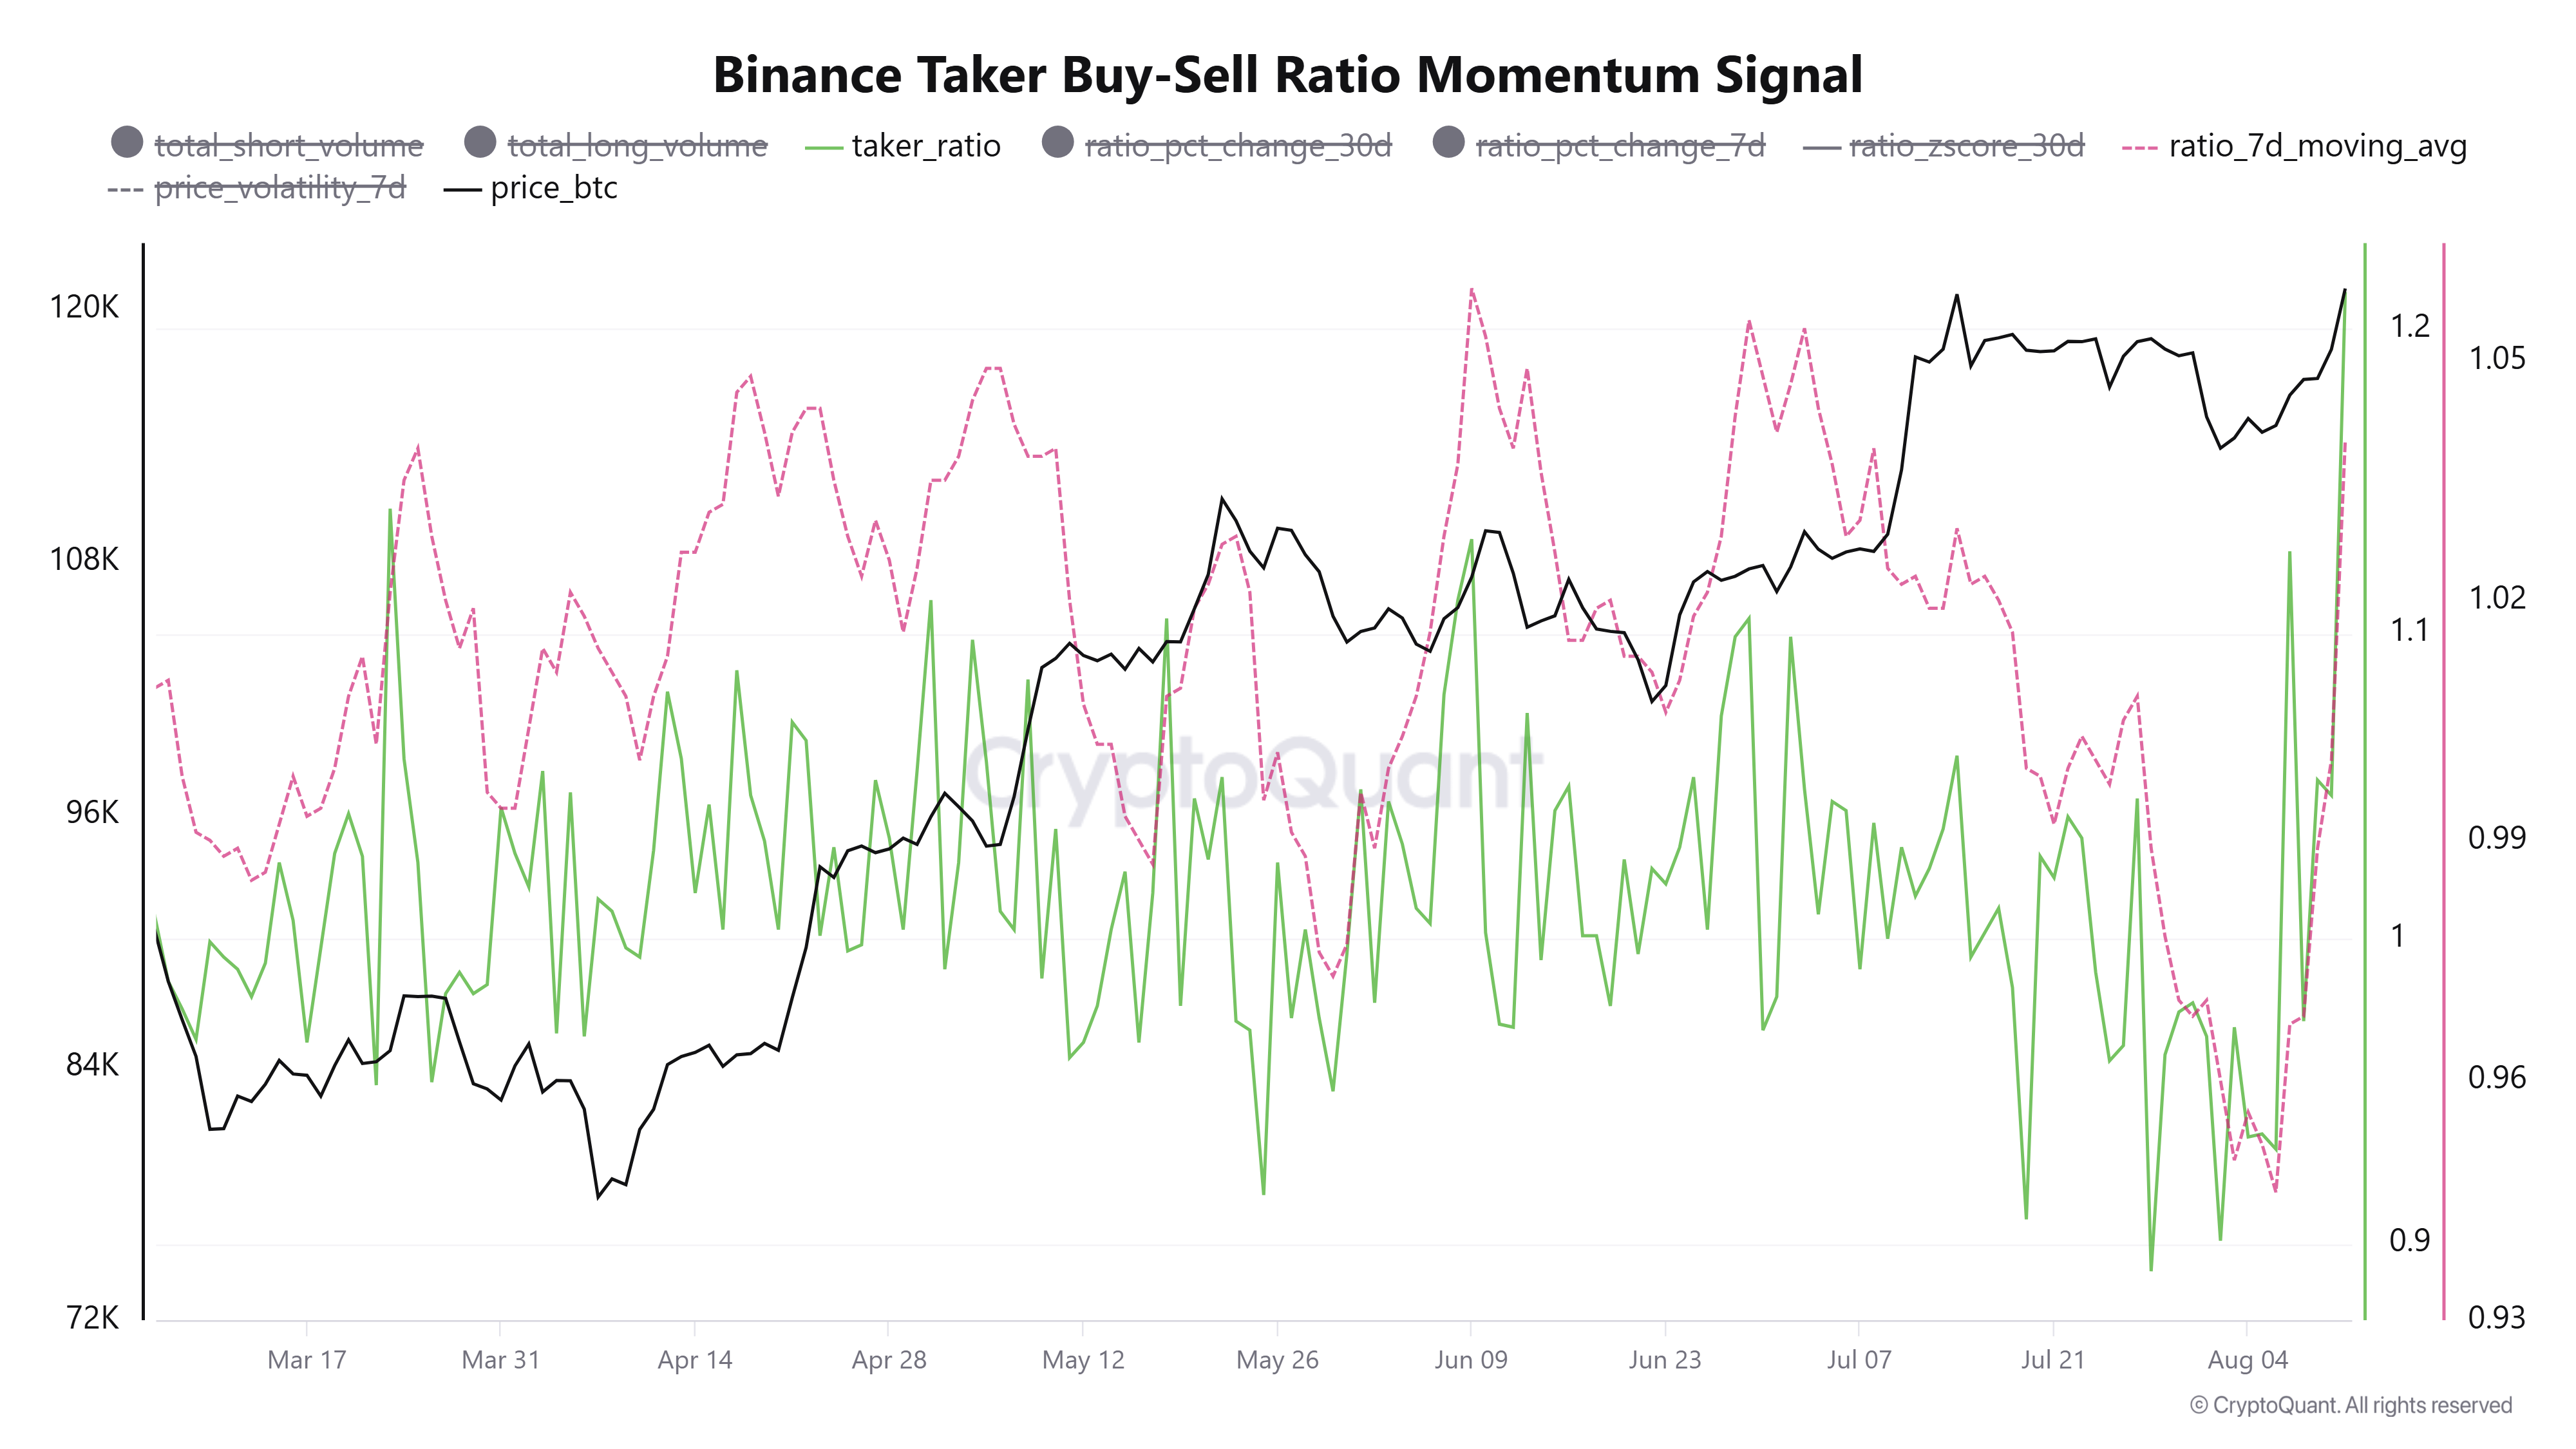
This signal was confirmed in August, with the Bitcoin taker buy-sell ratio exceeding the 7-day average to reach 1.21, its highest since March.
These three indicators — the futures to spot ratio at a record low, recovering CEX Volume ratio, and the taker buy-sell ratio in an uptrend — all suggest that the Bitcoin season began in August 2025.
Additionally, recent BeInCrypto analysis suggests that Bitcoin could rise further. However, it warns that the short-term uptrend will be invalidated if it falls below $118,900.