Stellar (XLM) is quietly rising, increasing by 10% last week and 3% in the past 24 hours. However, the rate of increase is not explosive. This is despite breaking through a bullish pattern on the daily chart earlier this month.
If the structure remains bullish, why hasn't the price surged? The answer lies in the tug-of-war between supply and demand occurring on-chain and on the charts.
Supply Pressure... Exchange Balances at All-Time High
The first clue comes from XLM's exchange balance. Over the past year, this has increased to a record 1.03 billion XLM (approximately $469.7 million), with July-August's 1.02 billion XLM recording one of the highest points in history.
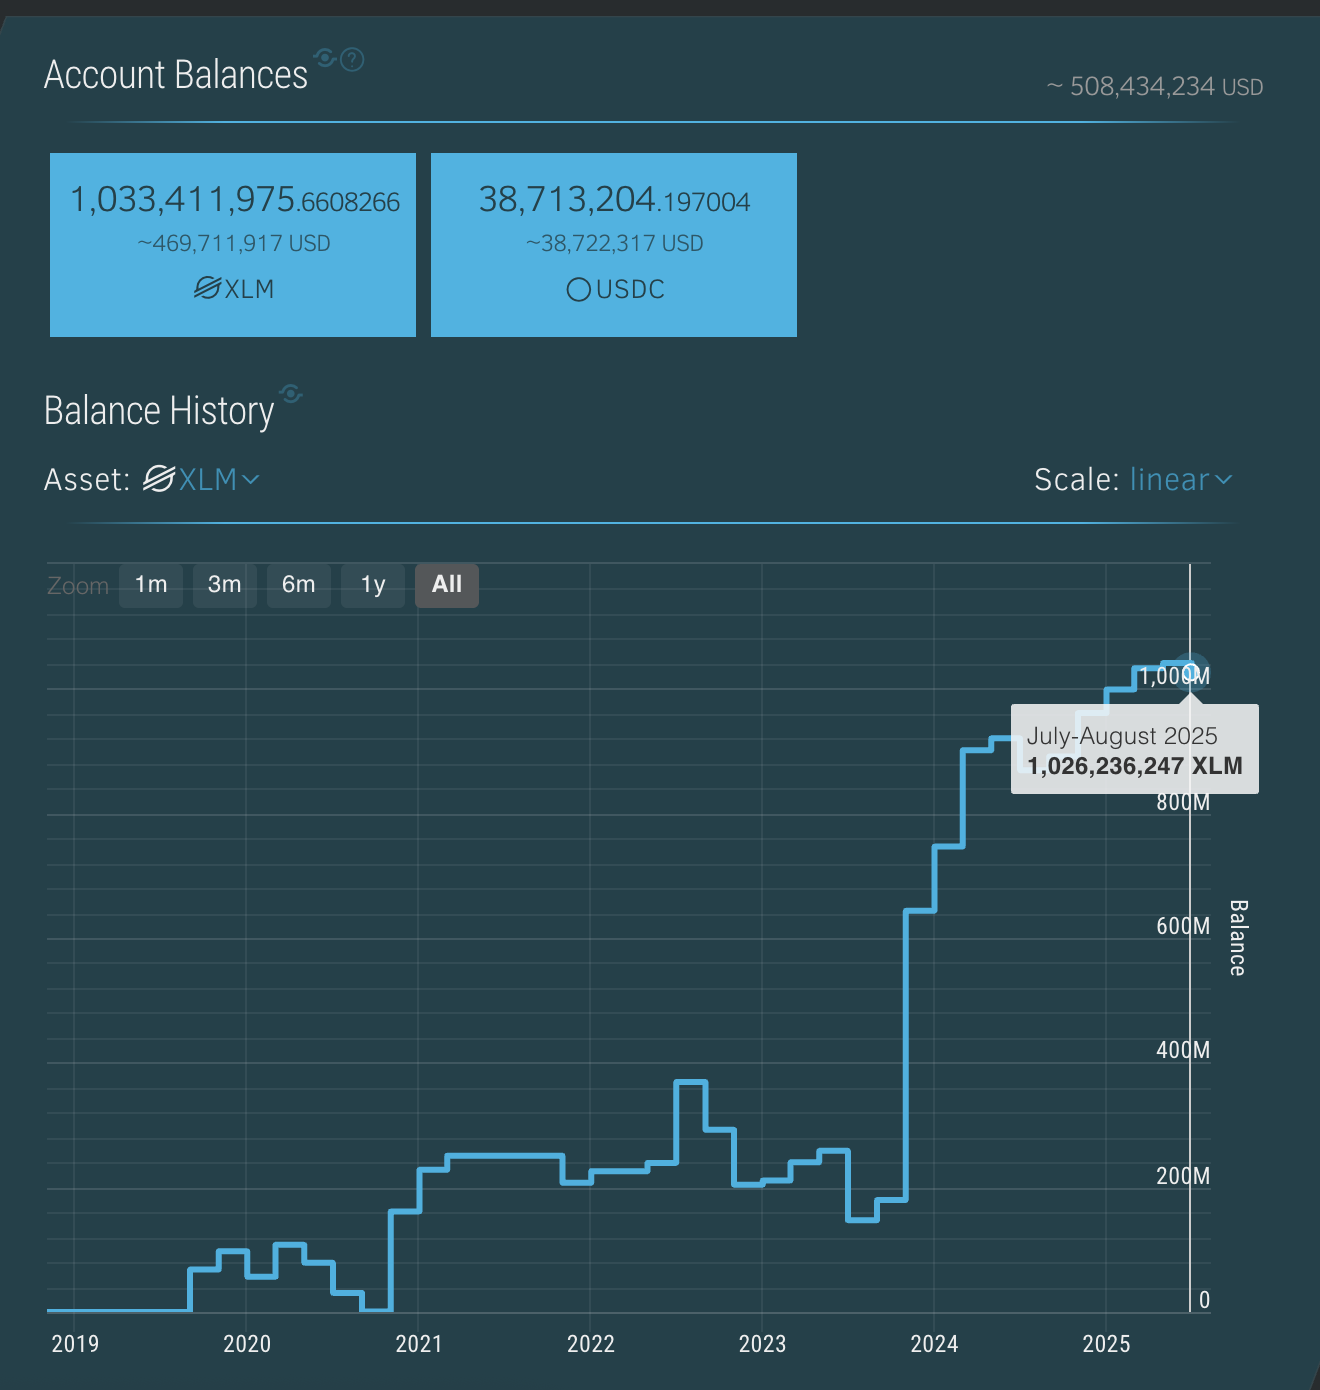
In fact, high balances mean more tokens are sitting on exchanges, making it easy for traders to sell.
This creates a ceiling effect: each time it rises, there's a risk of meeting a wave of sell orders. This supply surplus can explain why the Stellar price has not followed the rally seen in other altcoins even after breaking through a bullish pattern.
Token Technical Analysis and Market Update: Want more such token insights? Subscribe to the daily crypto newsletter by editor Harsh Notariya here.
Demand Side Pushback... Capital Flow Indicator Rising
Despite this heavy supply background, buying pressure has not disappeared. The Daily Money Flow Index (MFI), which tracks actual capital flows by combining price movement and volume, remains at 51.32 above 50, having recently risen after avoiding a retest near July's low of 29.
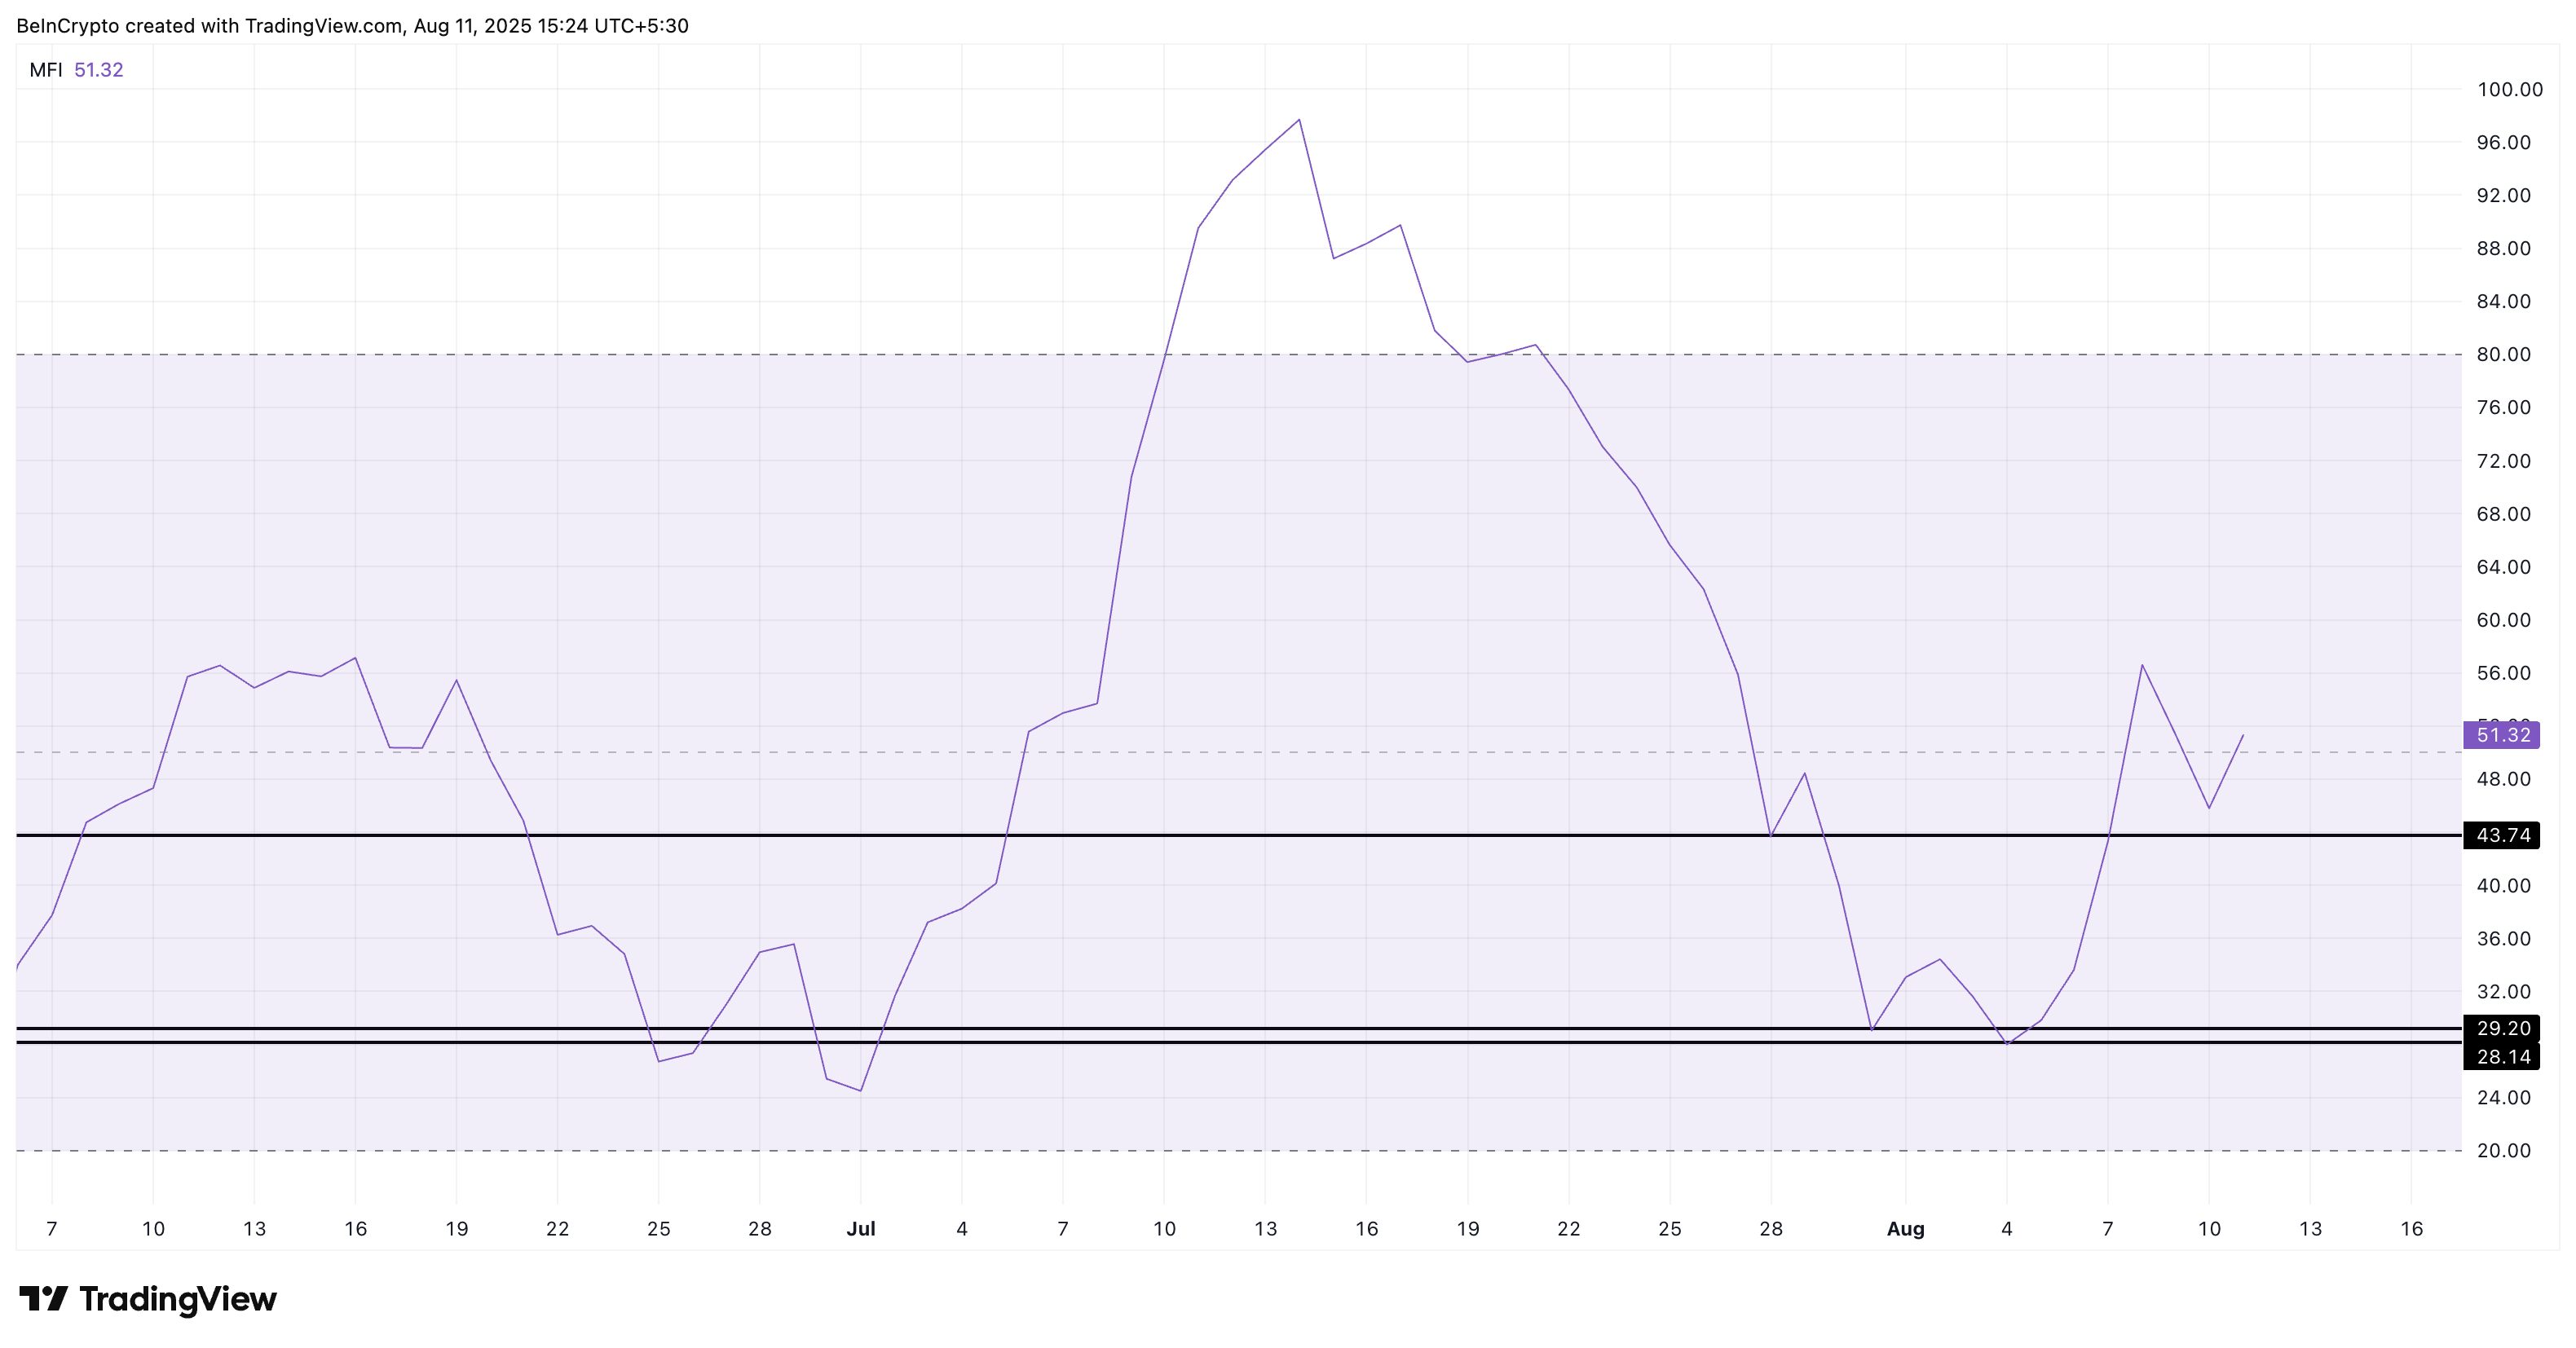
This suggests sellers are waiting, but there are still meaningful inflows into XLM. Buyers are active enough to prevent price drops, but not strong enough to overwhelm the record supply. This balance of power is maintaining the market.
Zoom In: 4-Hour Stellar Price Chart, Bullish Structure... Momentum Weakening
To confirm if this buy-sell deadlock will break, we look at the 4-hour chart. Here, the XLM price is within an ascending triangle, which is a bullish continuation setup, with key support at $0.44 and resistance at $0.46 and $0.47.
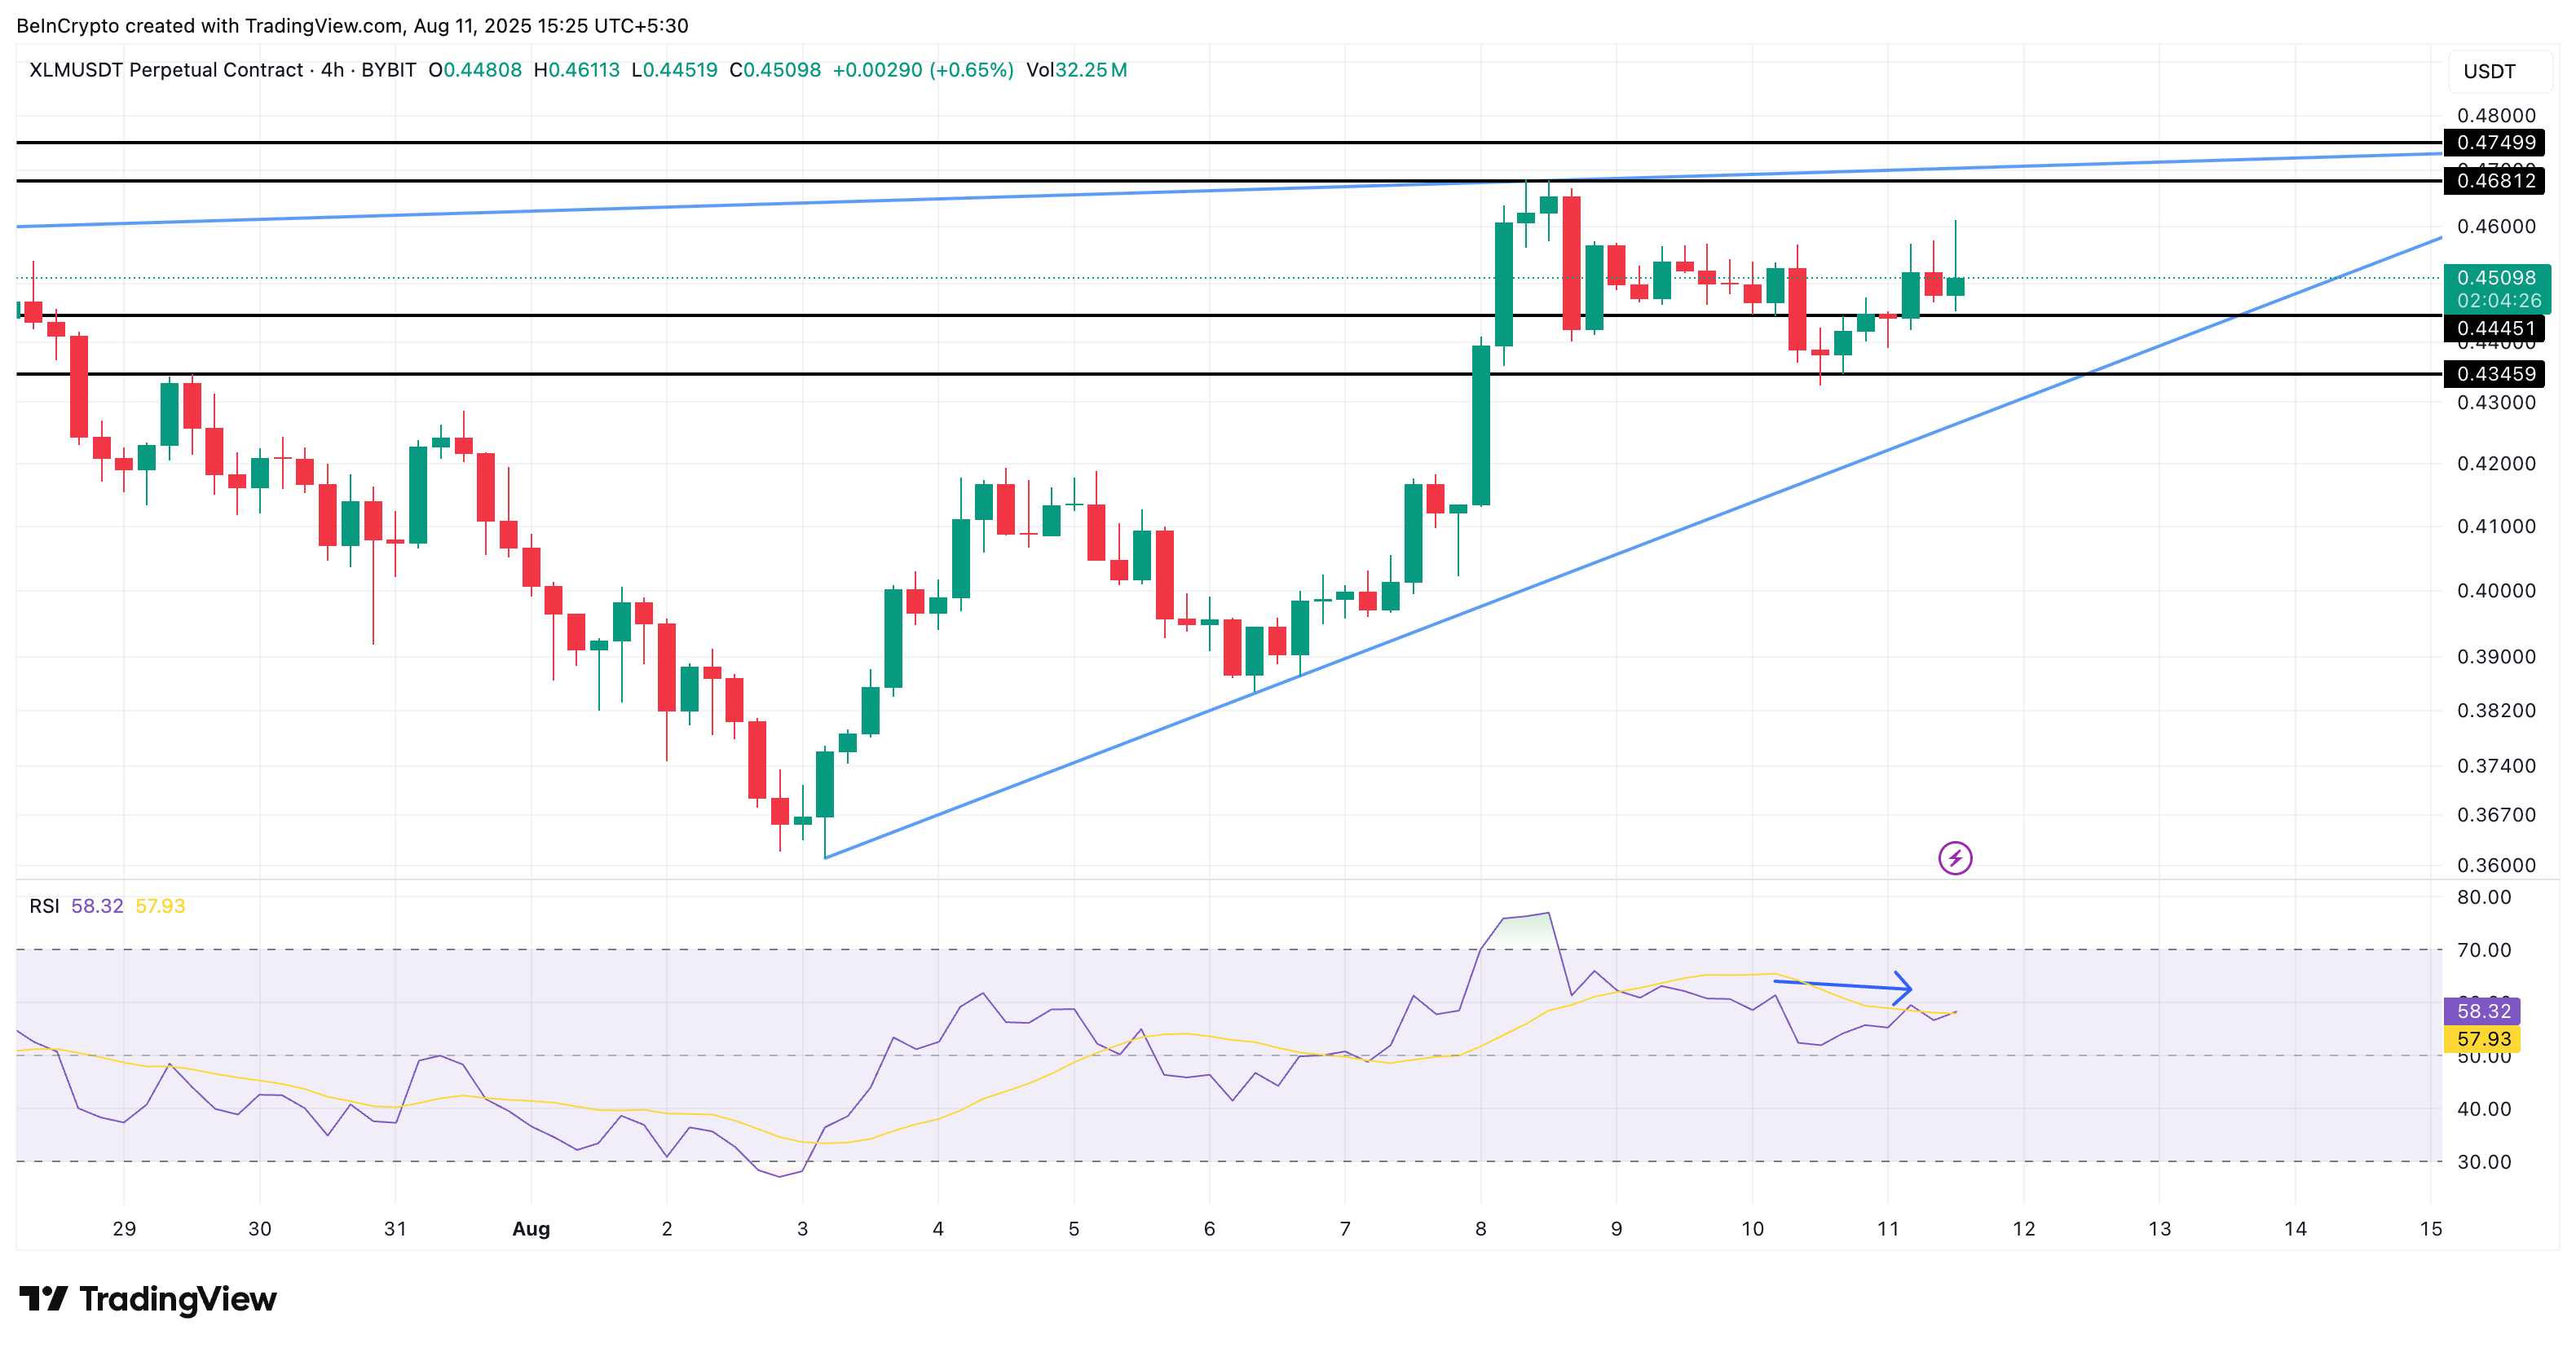
However, momentum is showing cracks. The RSI in this timeframe is recording lower highs despite the price making higher highs, suggesting short-term fatigue. Combined with high exchange balances, this slowdown explains why Stellar remains range-bound despite its bullish structure.
Breaking $0.47 could see the Stellar (XLM) price rise to new highs, which would also signify a clear pattern breakout. That level also coincides with a short liquidation cluster.
Reaching $0.47 could trigger short position liquidations, potentially pushing the XLM price higher, similar to a consecutive rally.
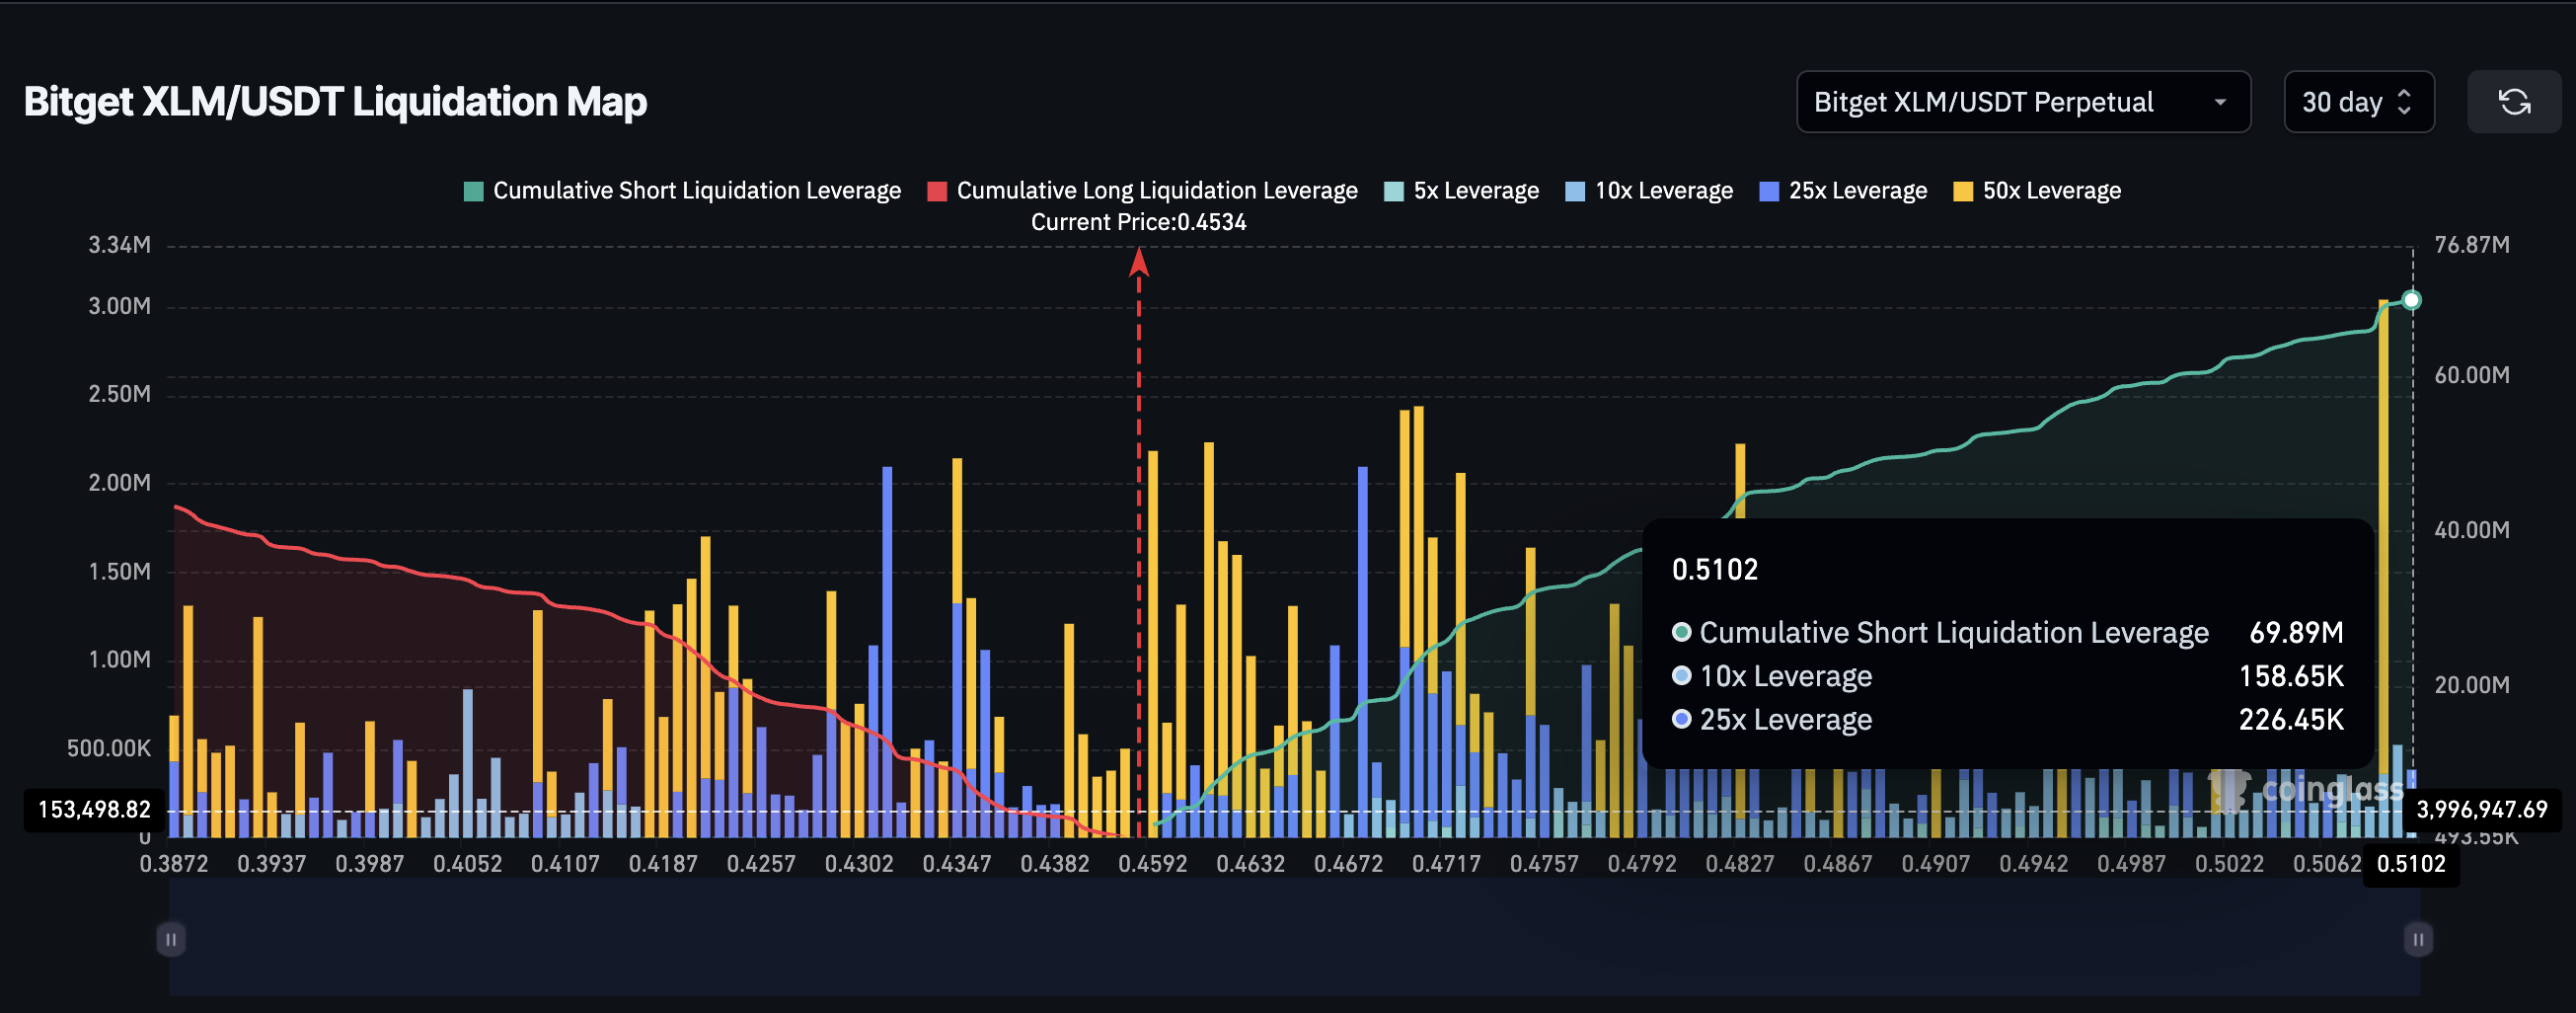
However, according to the chart, if the price corrects and falls below $0.43, the bullish structure could be at risk, which is also true for long positions liquidating at $0.43 and below.