XLM is one of the altcoins that has been gaining attention in recent weeks. Over the past three months, XLM's price has recorded approximately a 50% increase. However, the momentum has disappeared. It dropped 7% last month, fell another 7.5% last week, and declined 5.4% in the past 24 hours. This aligns with the overall market weakness.
As sellers apply more pressure, traders are questioning whether XLM's breakout can be sustained. On-chain and technical indicators show a mixed picture. Most signs point to weakness, but there is data suggesting that certain holder groups might be quietly building positions.
Spot and Derivatives Weakness
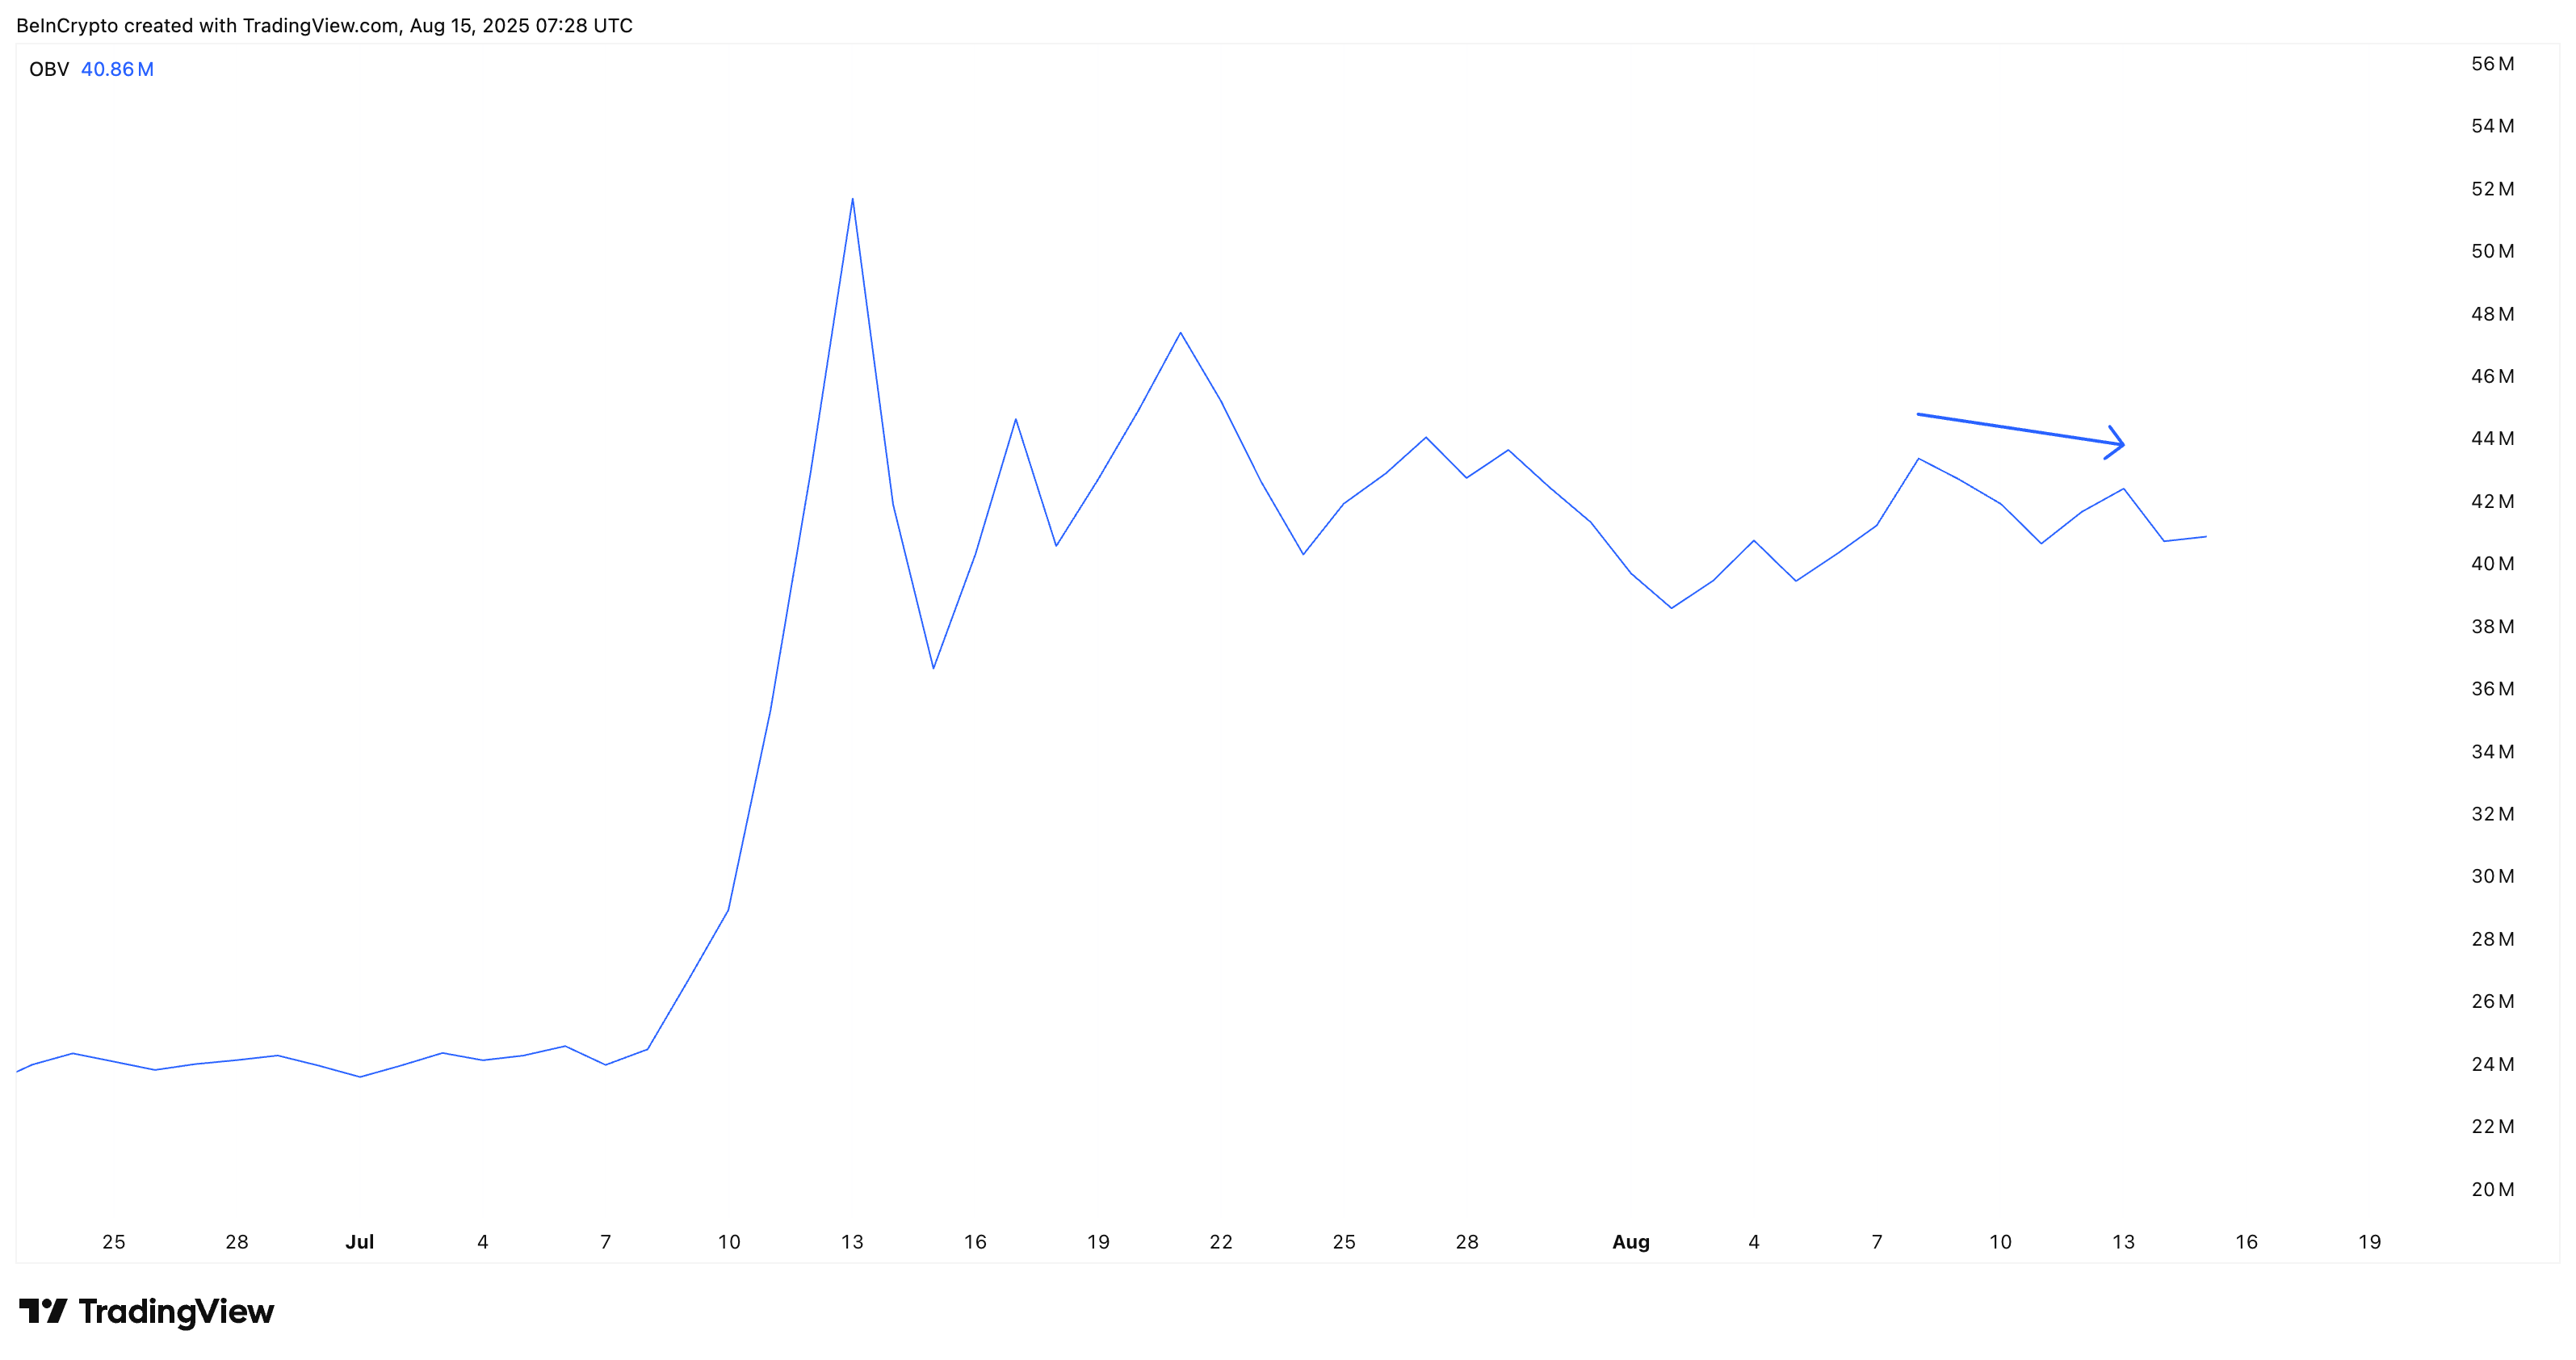
The first warning sign appears in market participation. When XLM price recorded higher highs on the price chart (between August 8th and 13th), the On-Balance Volume (OBV) recorded lower highs. This suggests that spot buying interest is not following the same momentum. This difference indicates that the rally faced lighter buying pressure, limiting its sustainability.
The story is similar in derivatives. Stellar's futures open interest has been steadily decreasing, dropping from around $420 million in mid-July to approximately $260 million currently.
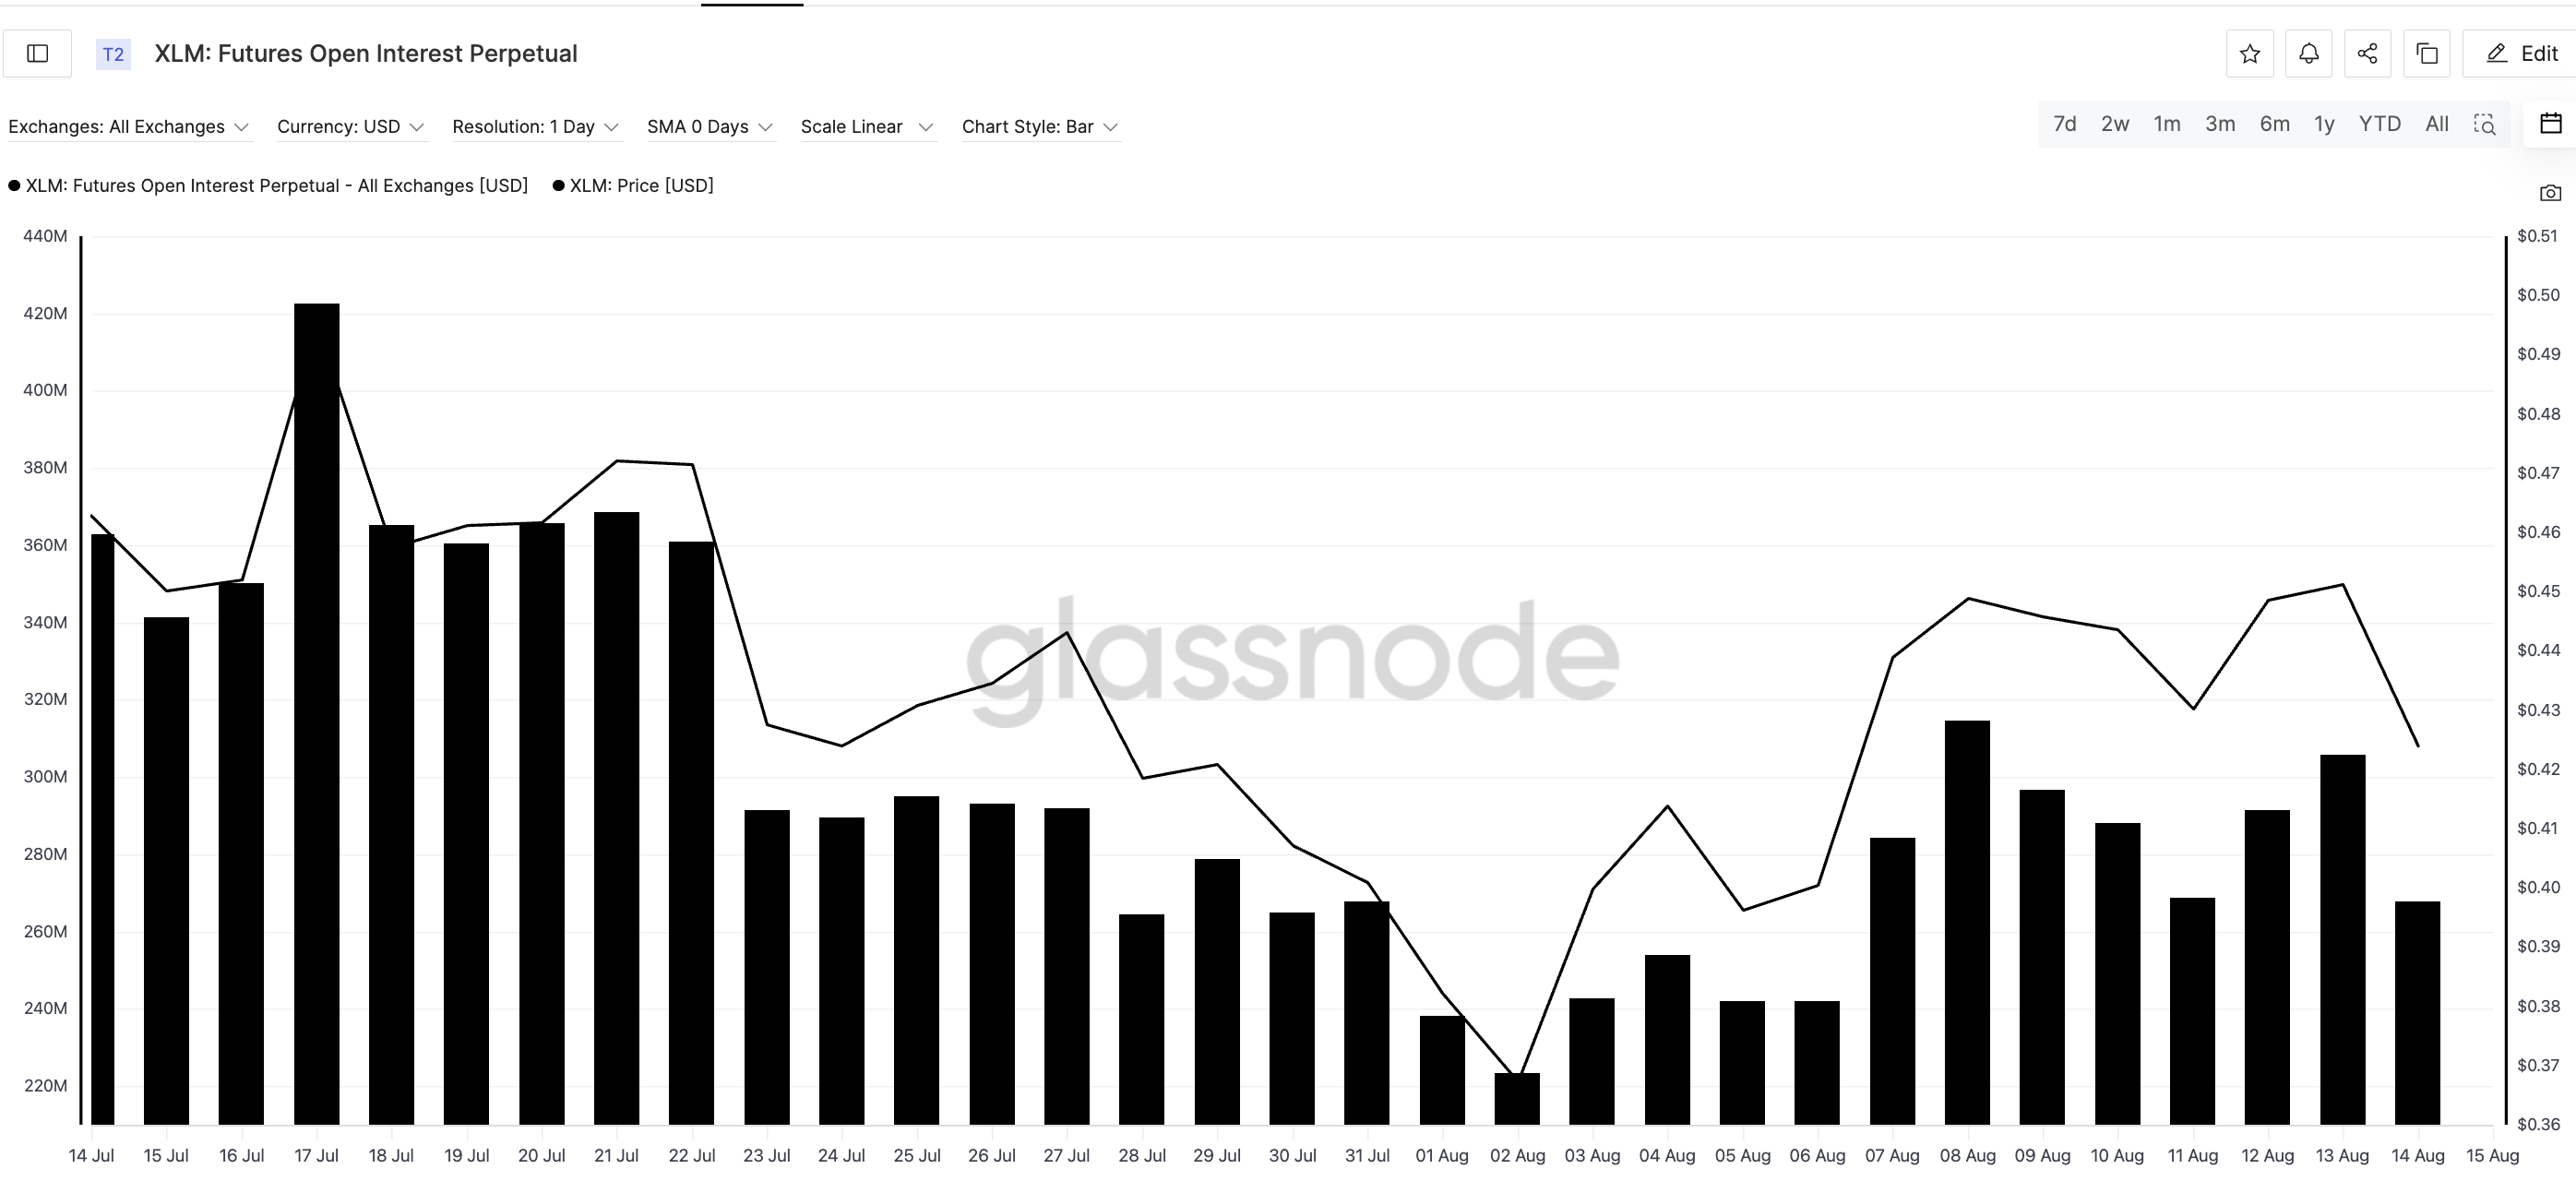
This decline shows that leveraged traders are retreating, which often reduces the speculative fuel that sustains a breakout. With both spot demand and leverage exposure decreasing, the market's immediate stance is cautious.
Perpetual futures open interest represents the total value of all active perpetual futures contracts that are not yet closed or settled, showing how much capital is invested in the market at a given time.
Token Technical Analysis and Market Update: Want more of these token insights? Subscribe to the daily crypto newsletter by editor Harsh Notariya here.
Long-Term Holders Reducing Positions... Short-Term Holders Entering
The HODL Cave indicator maps the historical return distribution of XLM holders at the current point (3,837 days) across various percentiles.
For example, a 100th percentile value of 117.67x means that the best-performing holding period during this time provided at least 117.67x returns.
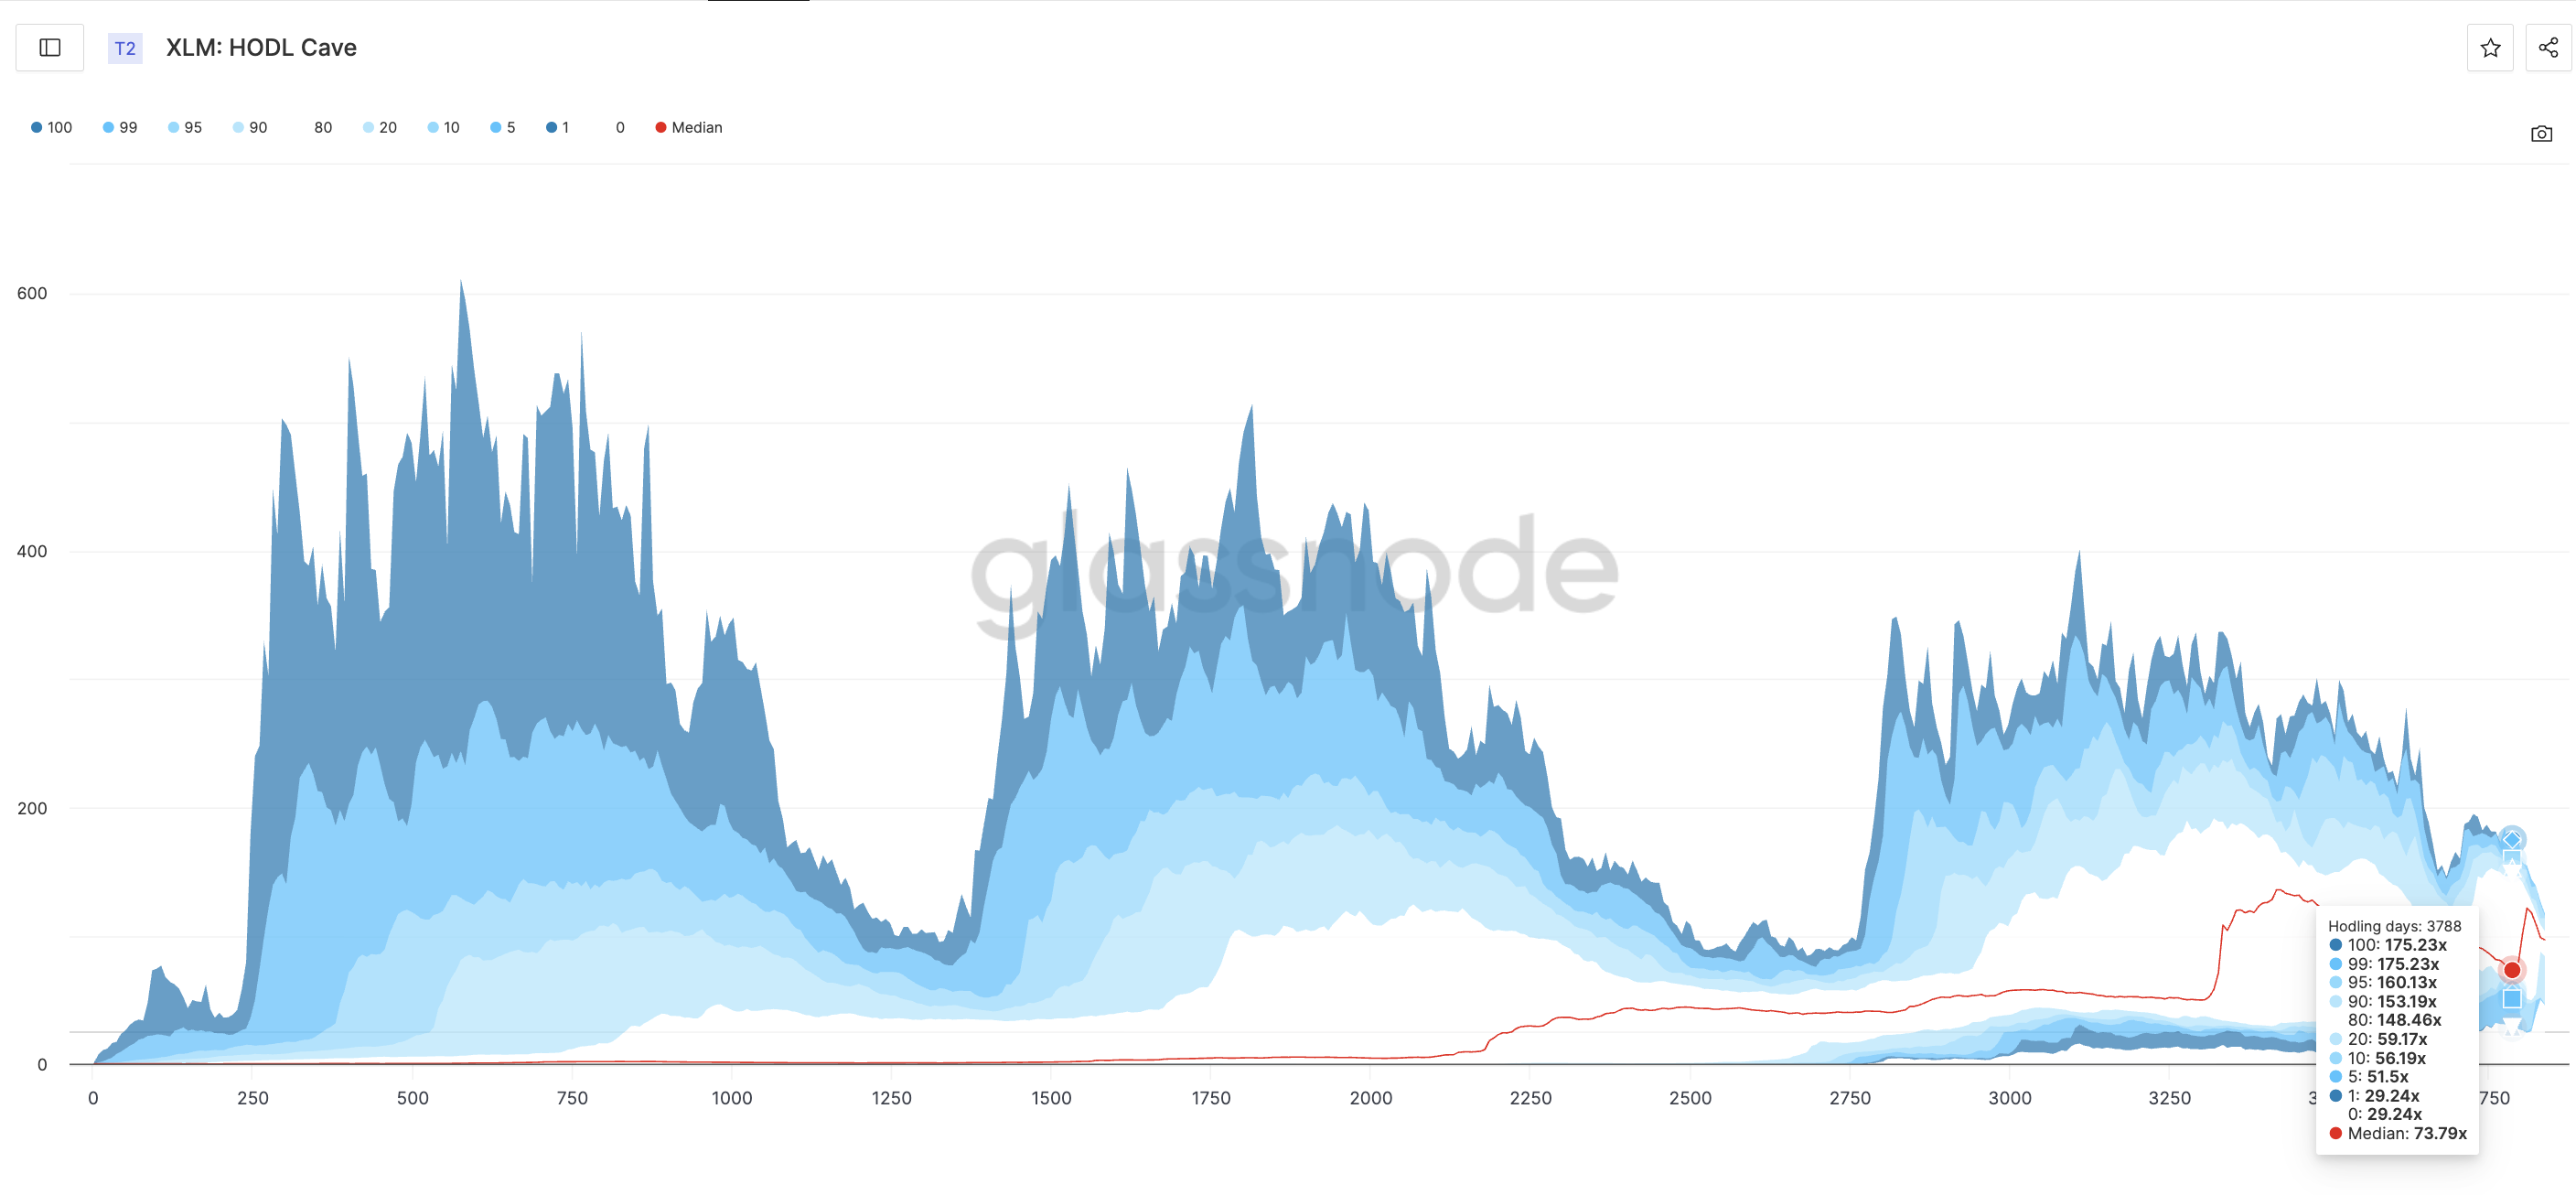
Between holding days 3,788 and 3,837, XLM's median historical return (50th percentile) rose from 73.79x to 97.35x. This indicates an improvement in average returns across all holding periods. However, this increase is hiding a rotation:
- The highest percentile bands — 100, 99, 95, 90, and even 80 — have sharply declined. This suggests that the best historical returns for long-term holders have now lowered, consistent with profit-taking from old coins.
- The lowest percentile bands — 0, 1, 10, 20 — have strongly risen (e.g., the 20th percentile increased from 59.17x to 84.81x). This indicates that even the weakest historical returns for short holding periods are improving.
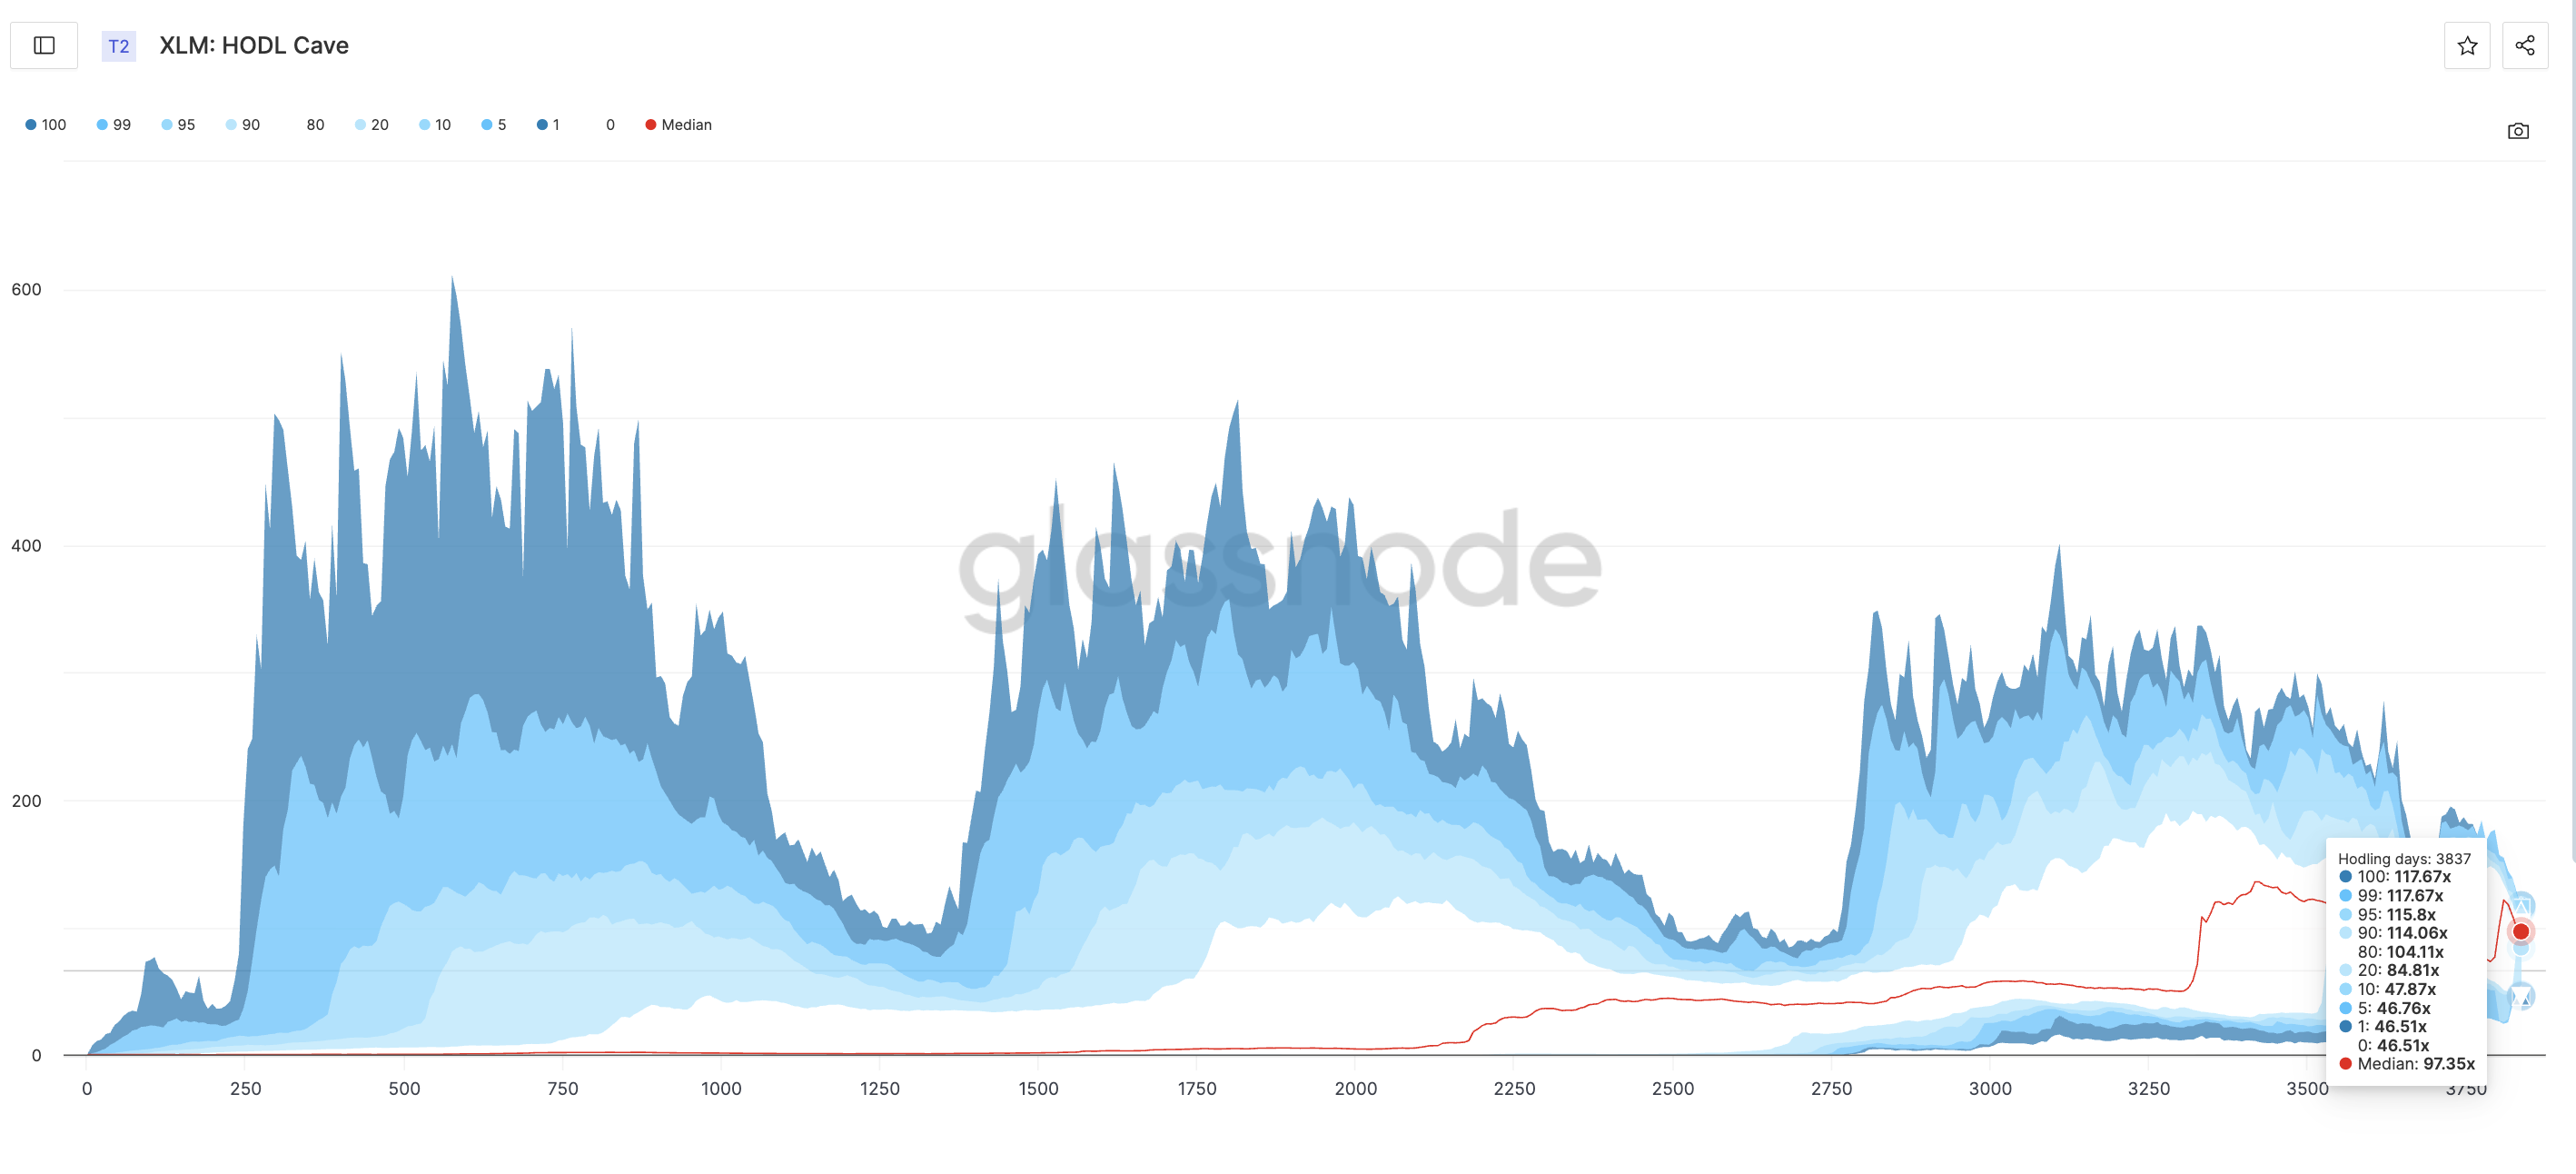
This pattern suggests that old high-yield coins are being sold in the market, but new buyers are selectively purchasing during the weakness. In other words, long-term holders are distributing, and new participants are selectively buying during the downturn.
Combined with spot and futures data, the picture remains mixed. Spot trading volume and OBV are still sluggish, and futures positioning has not shown consistent building. These two indicators show that momentum buyers have not yet strongly returned. However, the improvement in the lower percentile bands of the HODL Cave suggests that at least part of the market is quietly positioning.
XLM Key Levels, Box Range Movement
XLM price is currently trading near $0.42. This is within two major zones. Losing $0.40 (major support) could lead to a drop to $0.38 and $0.36. Conversely, recovering $0.46 (major resistance) would reveal $0.48, and breaking that level could retest the local high of $0.52.
However, XLM price has been moving within this support-resistance zone over the past few trading days, implying uncertainty.
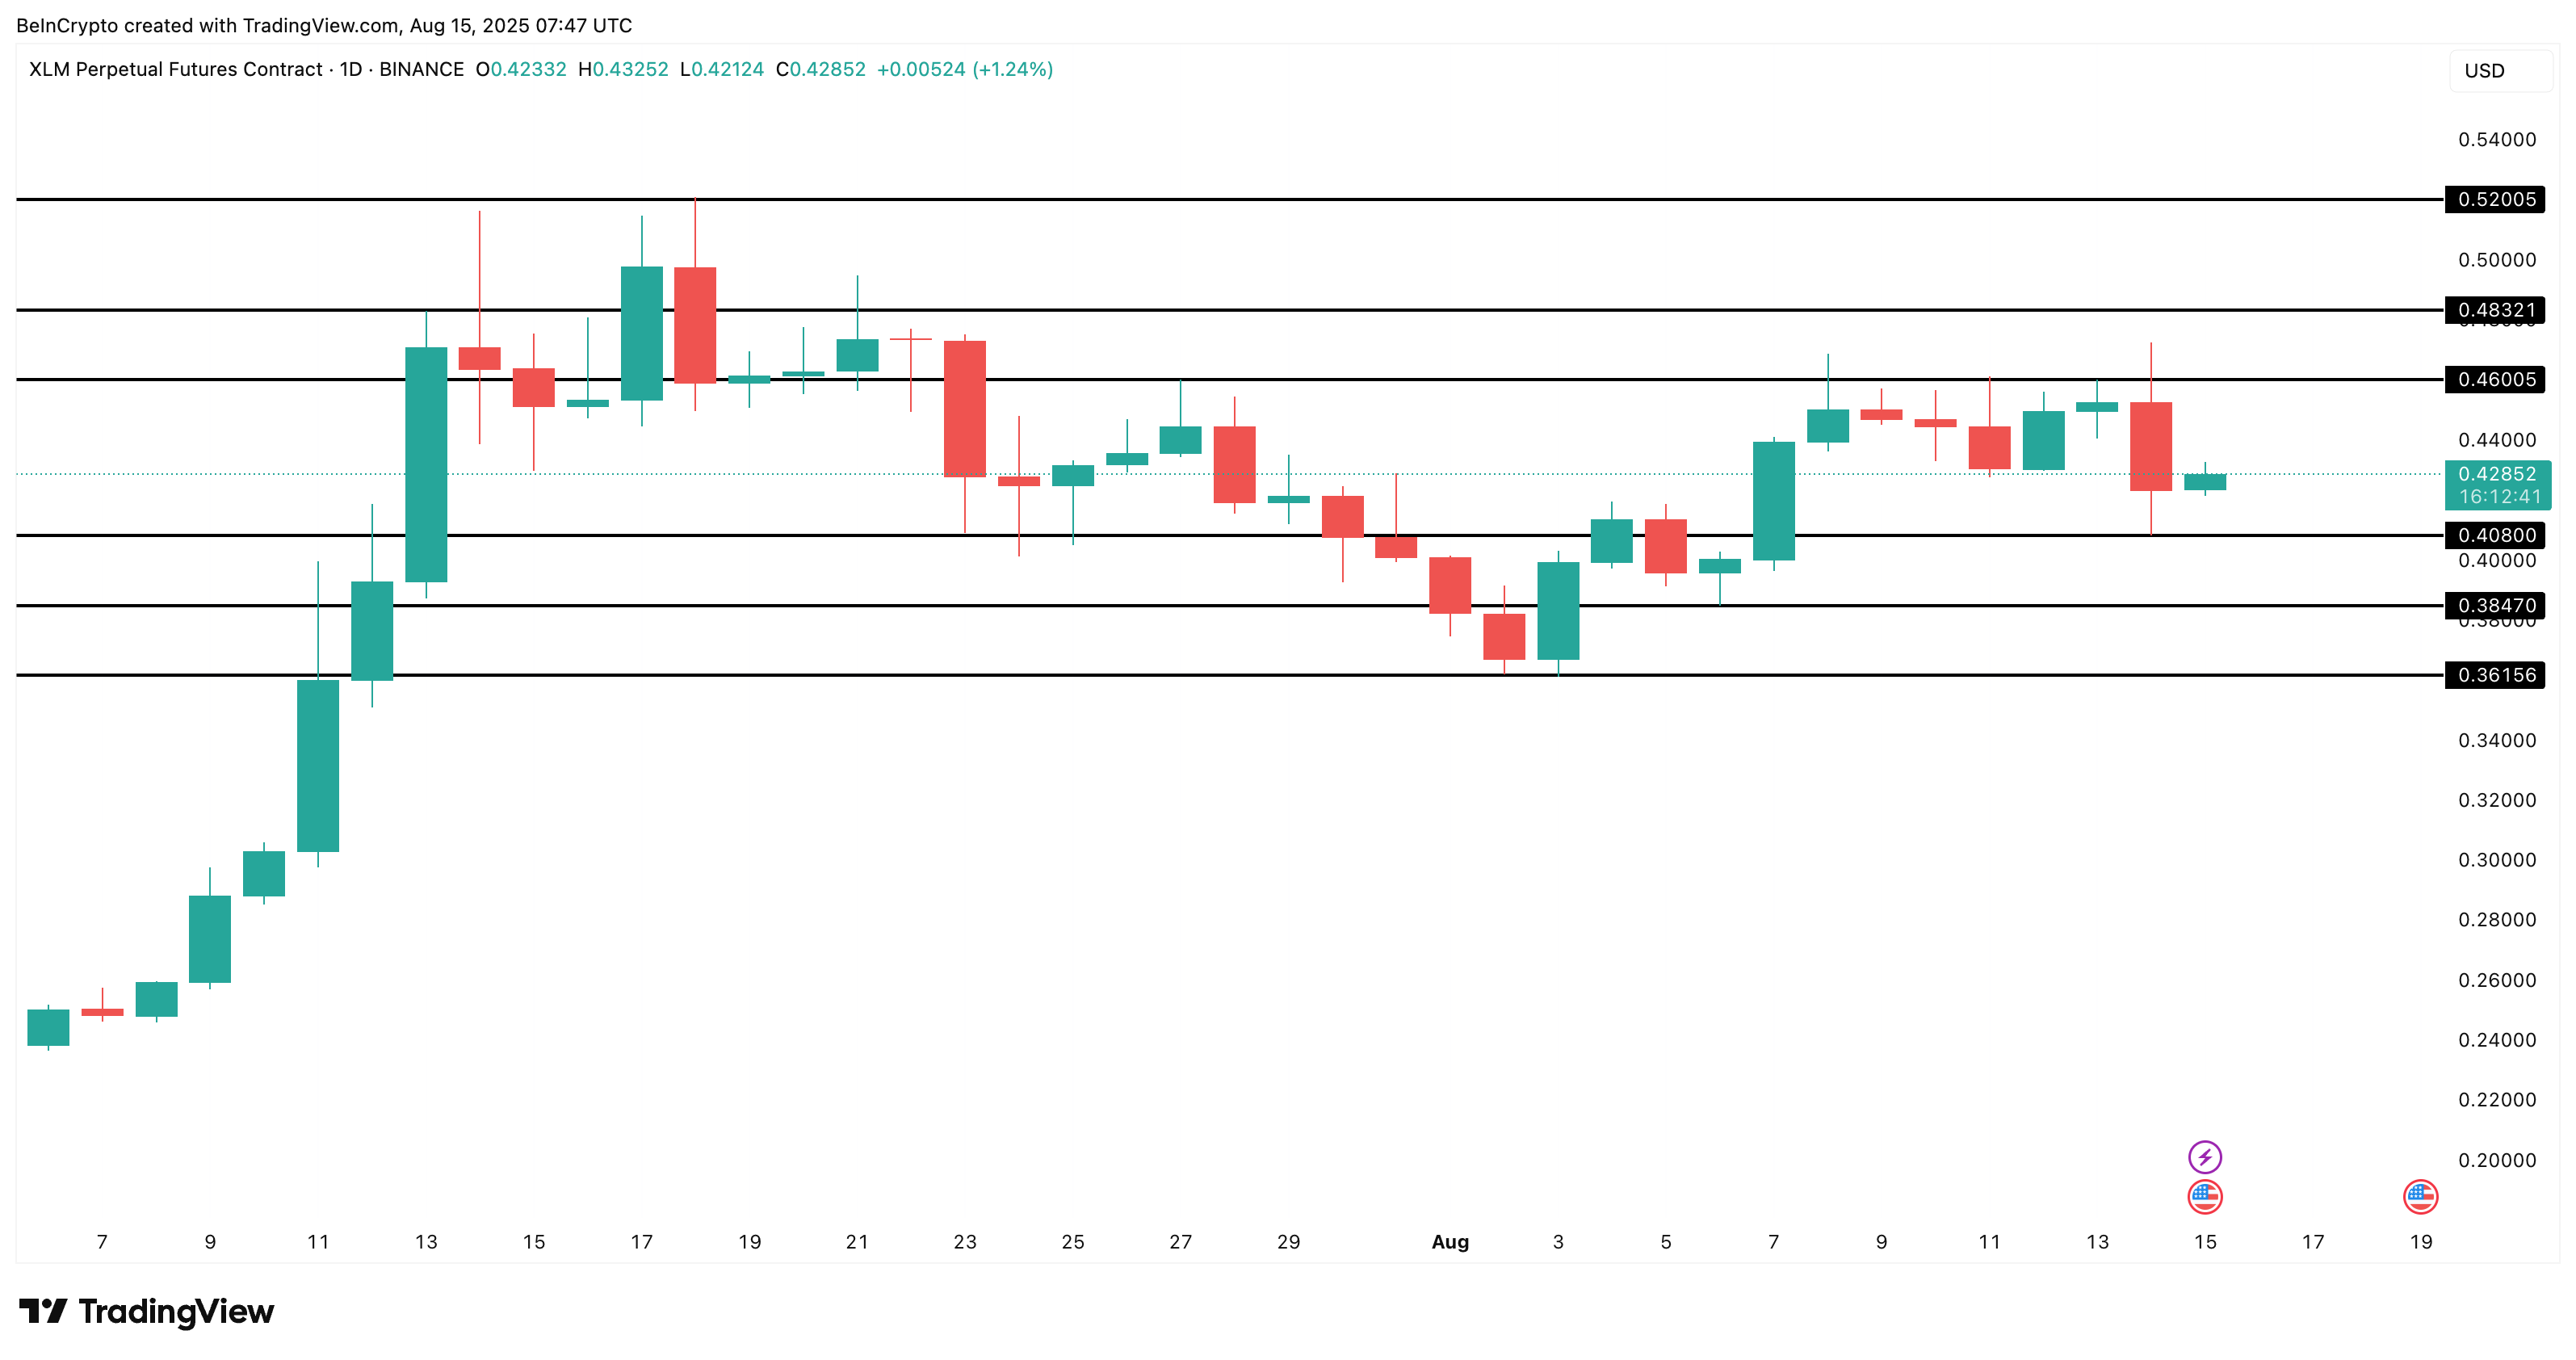
The current chart suggests a weak foundation. However, the HODL Cave indicator implies that short-term and medium-term buyers might be quietly preparing for the next stage. If XLM price loses $0.36, the entire uptrend could disappear, potentially leading to a new swing low.